

A CommerceGurus community survey
The State of the Woo Ecosystem, 2026
We were delighted that our community took the time to share how they work with WooCommerce. This first report draws on their responses to highlight the findings most relevant to the wider WooCommerce industry.



Slide 1 of 21
Headline numbers
Citable data from the report
A concise, citable digest of our Community Survey report’s most useful findings.
About the survey
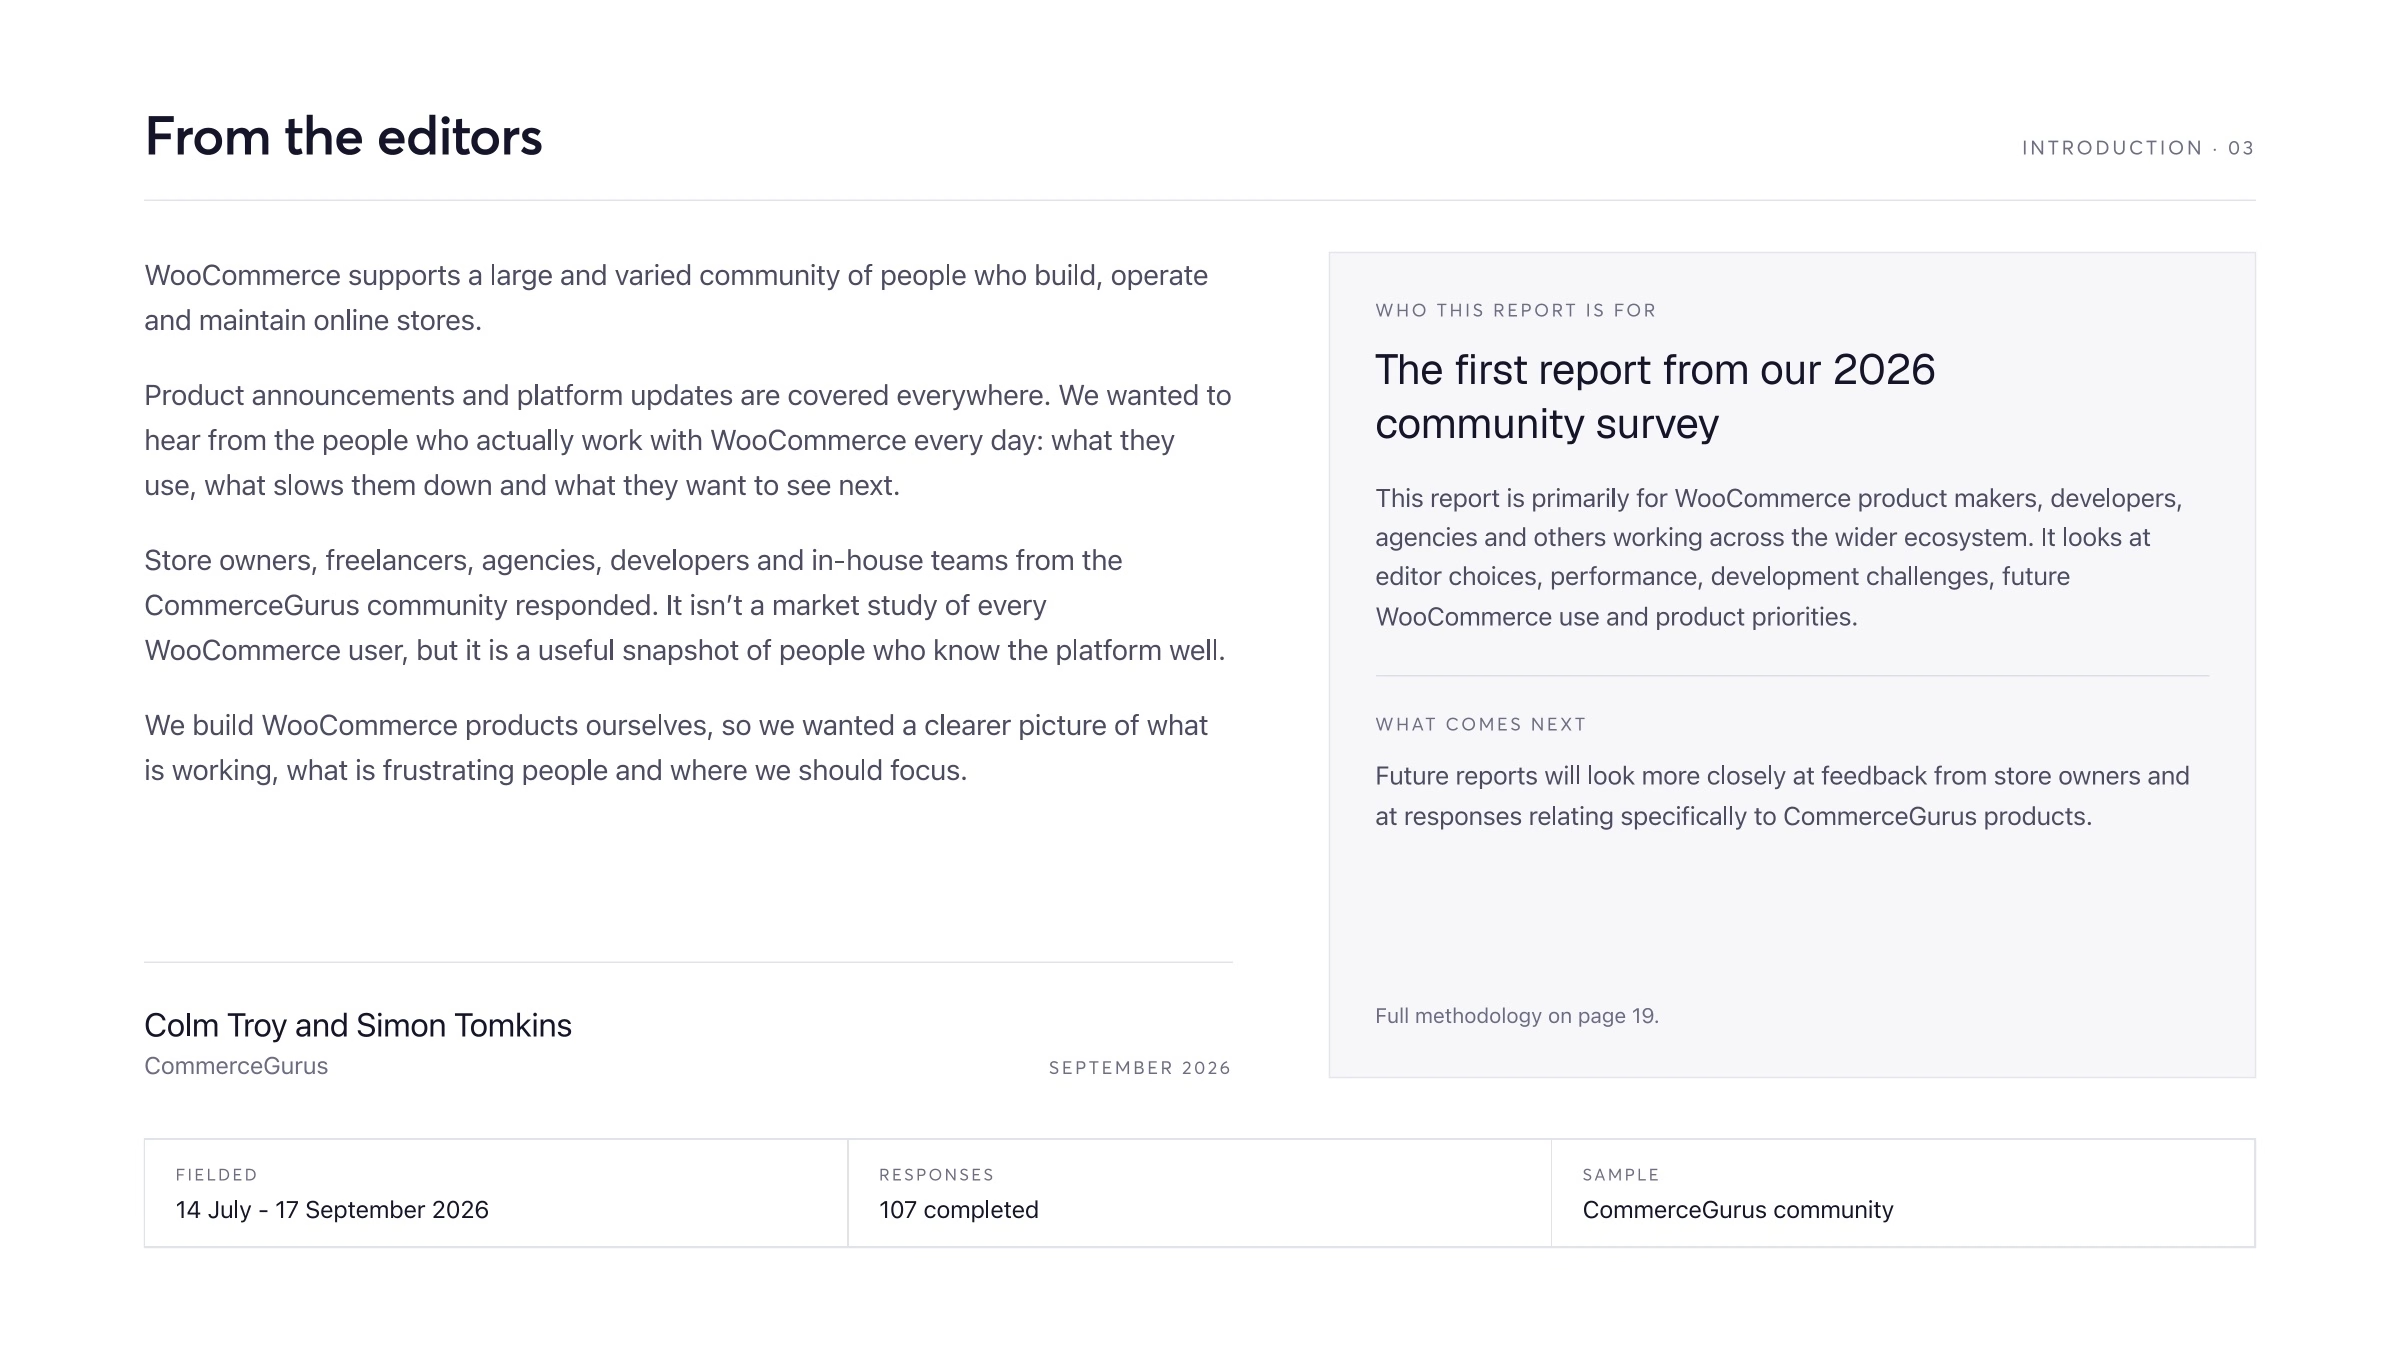
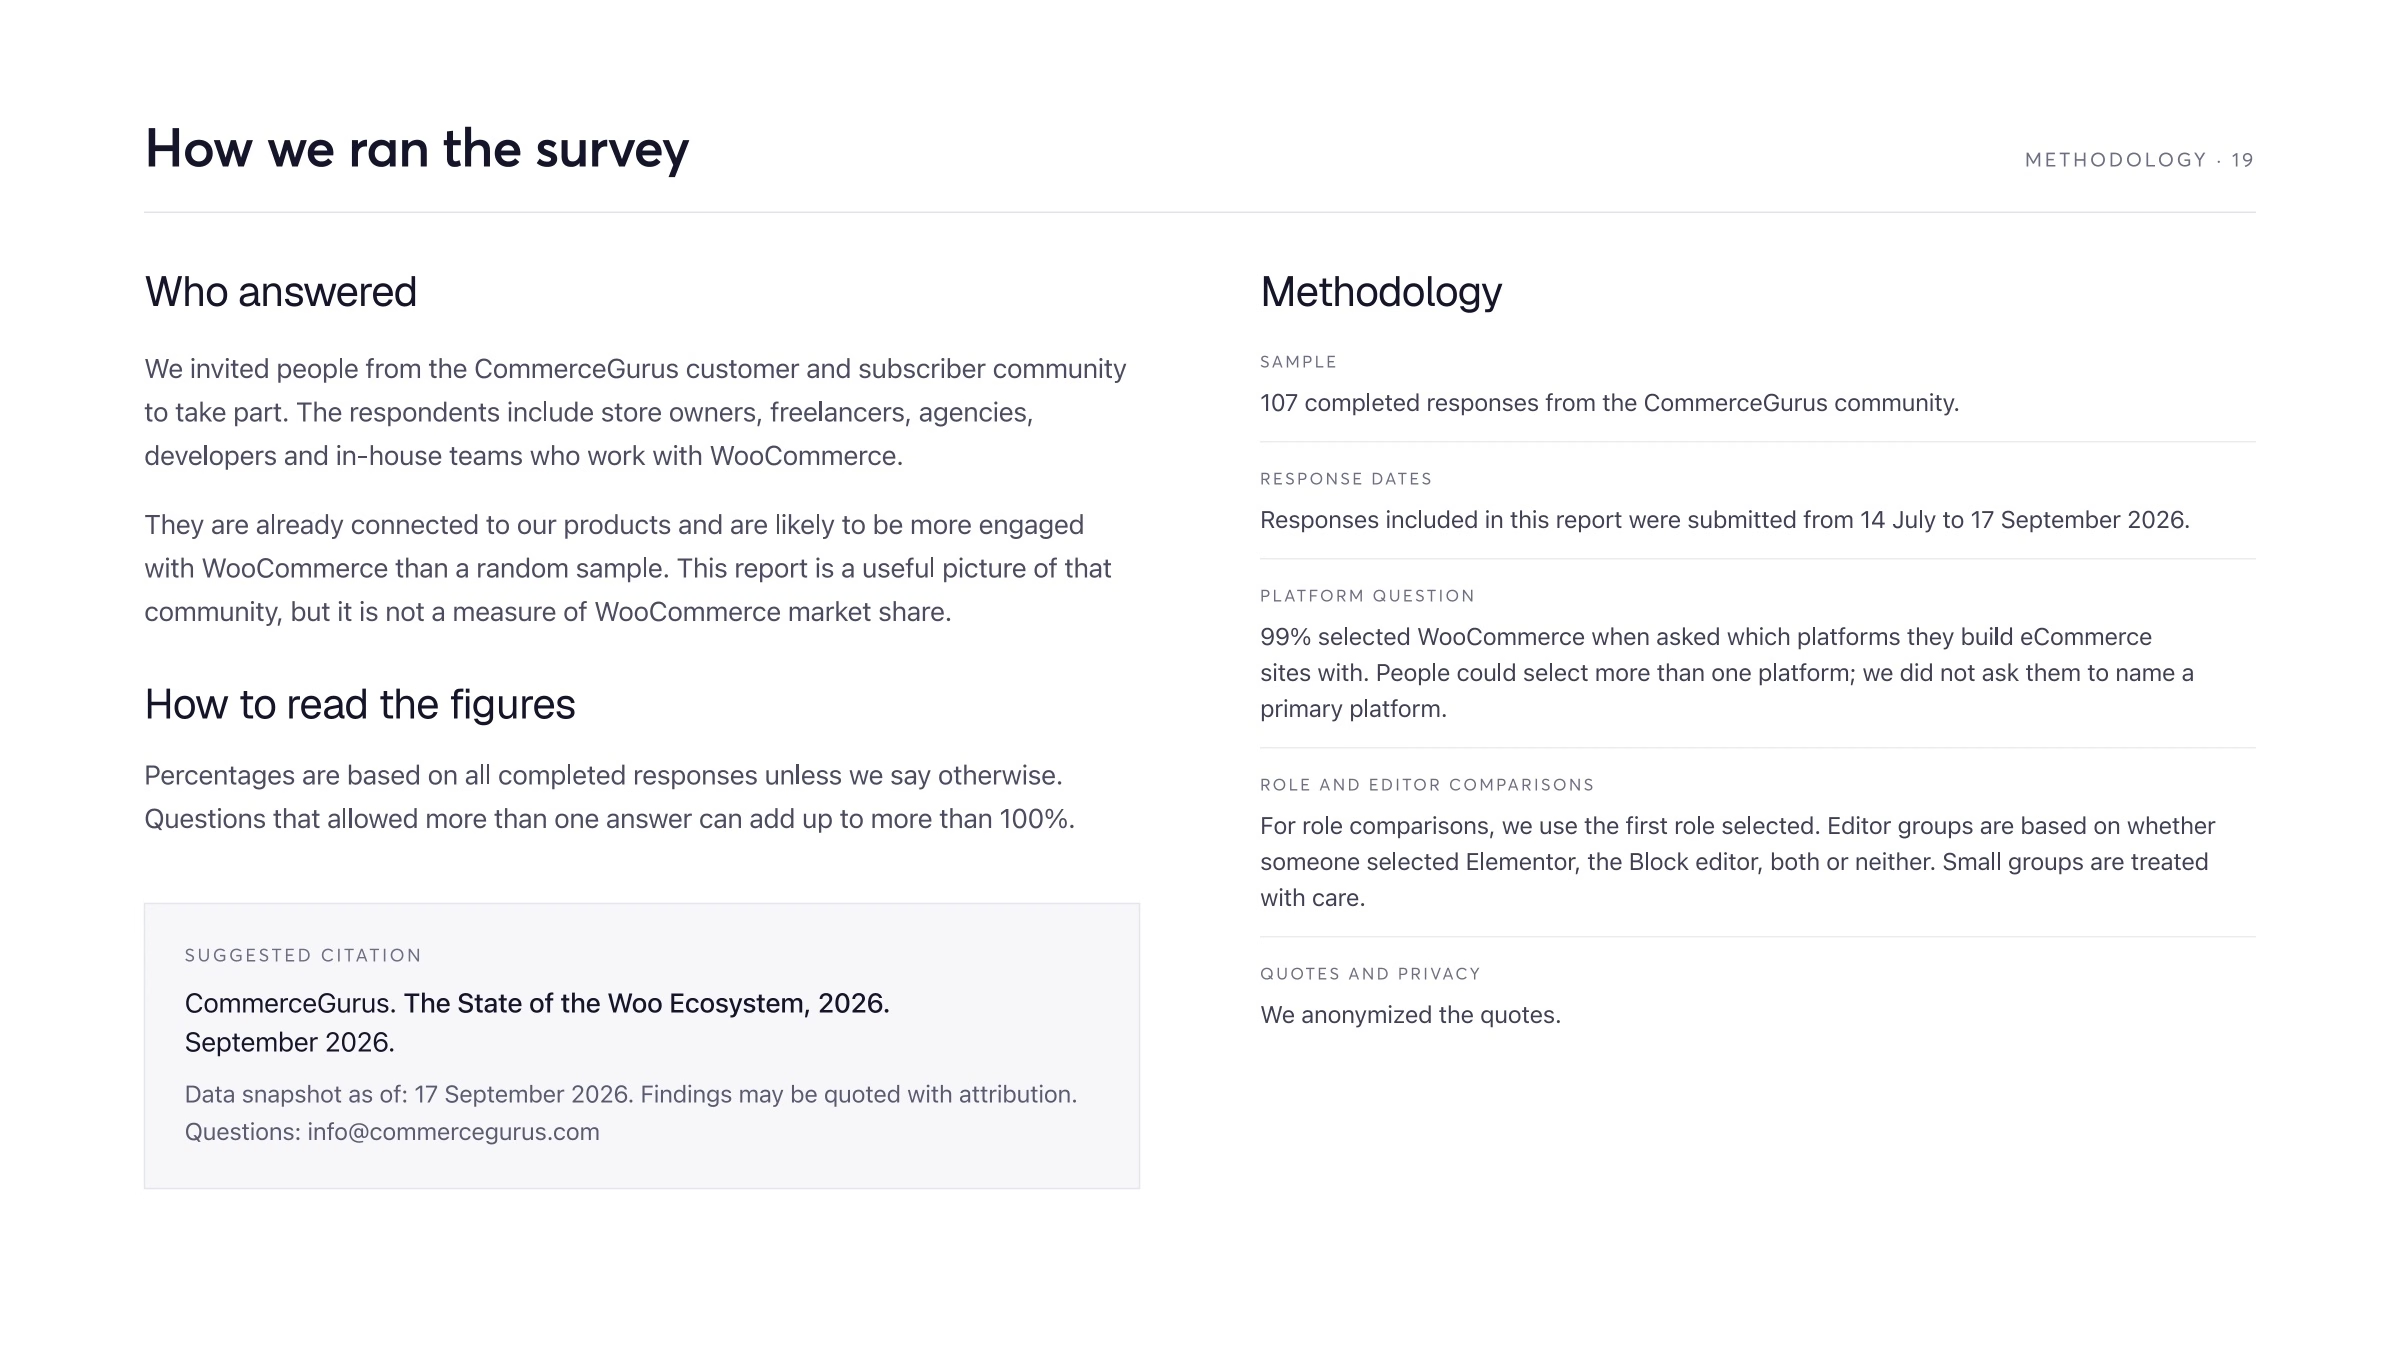
The report draws on 107 completed responses from the CommerceGurus community, collected between 14 July and 17 September 2026.
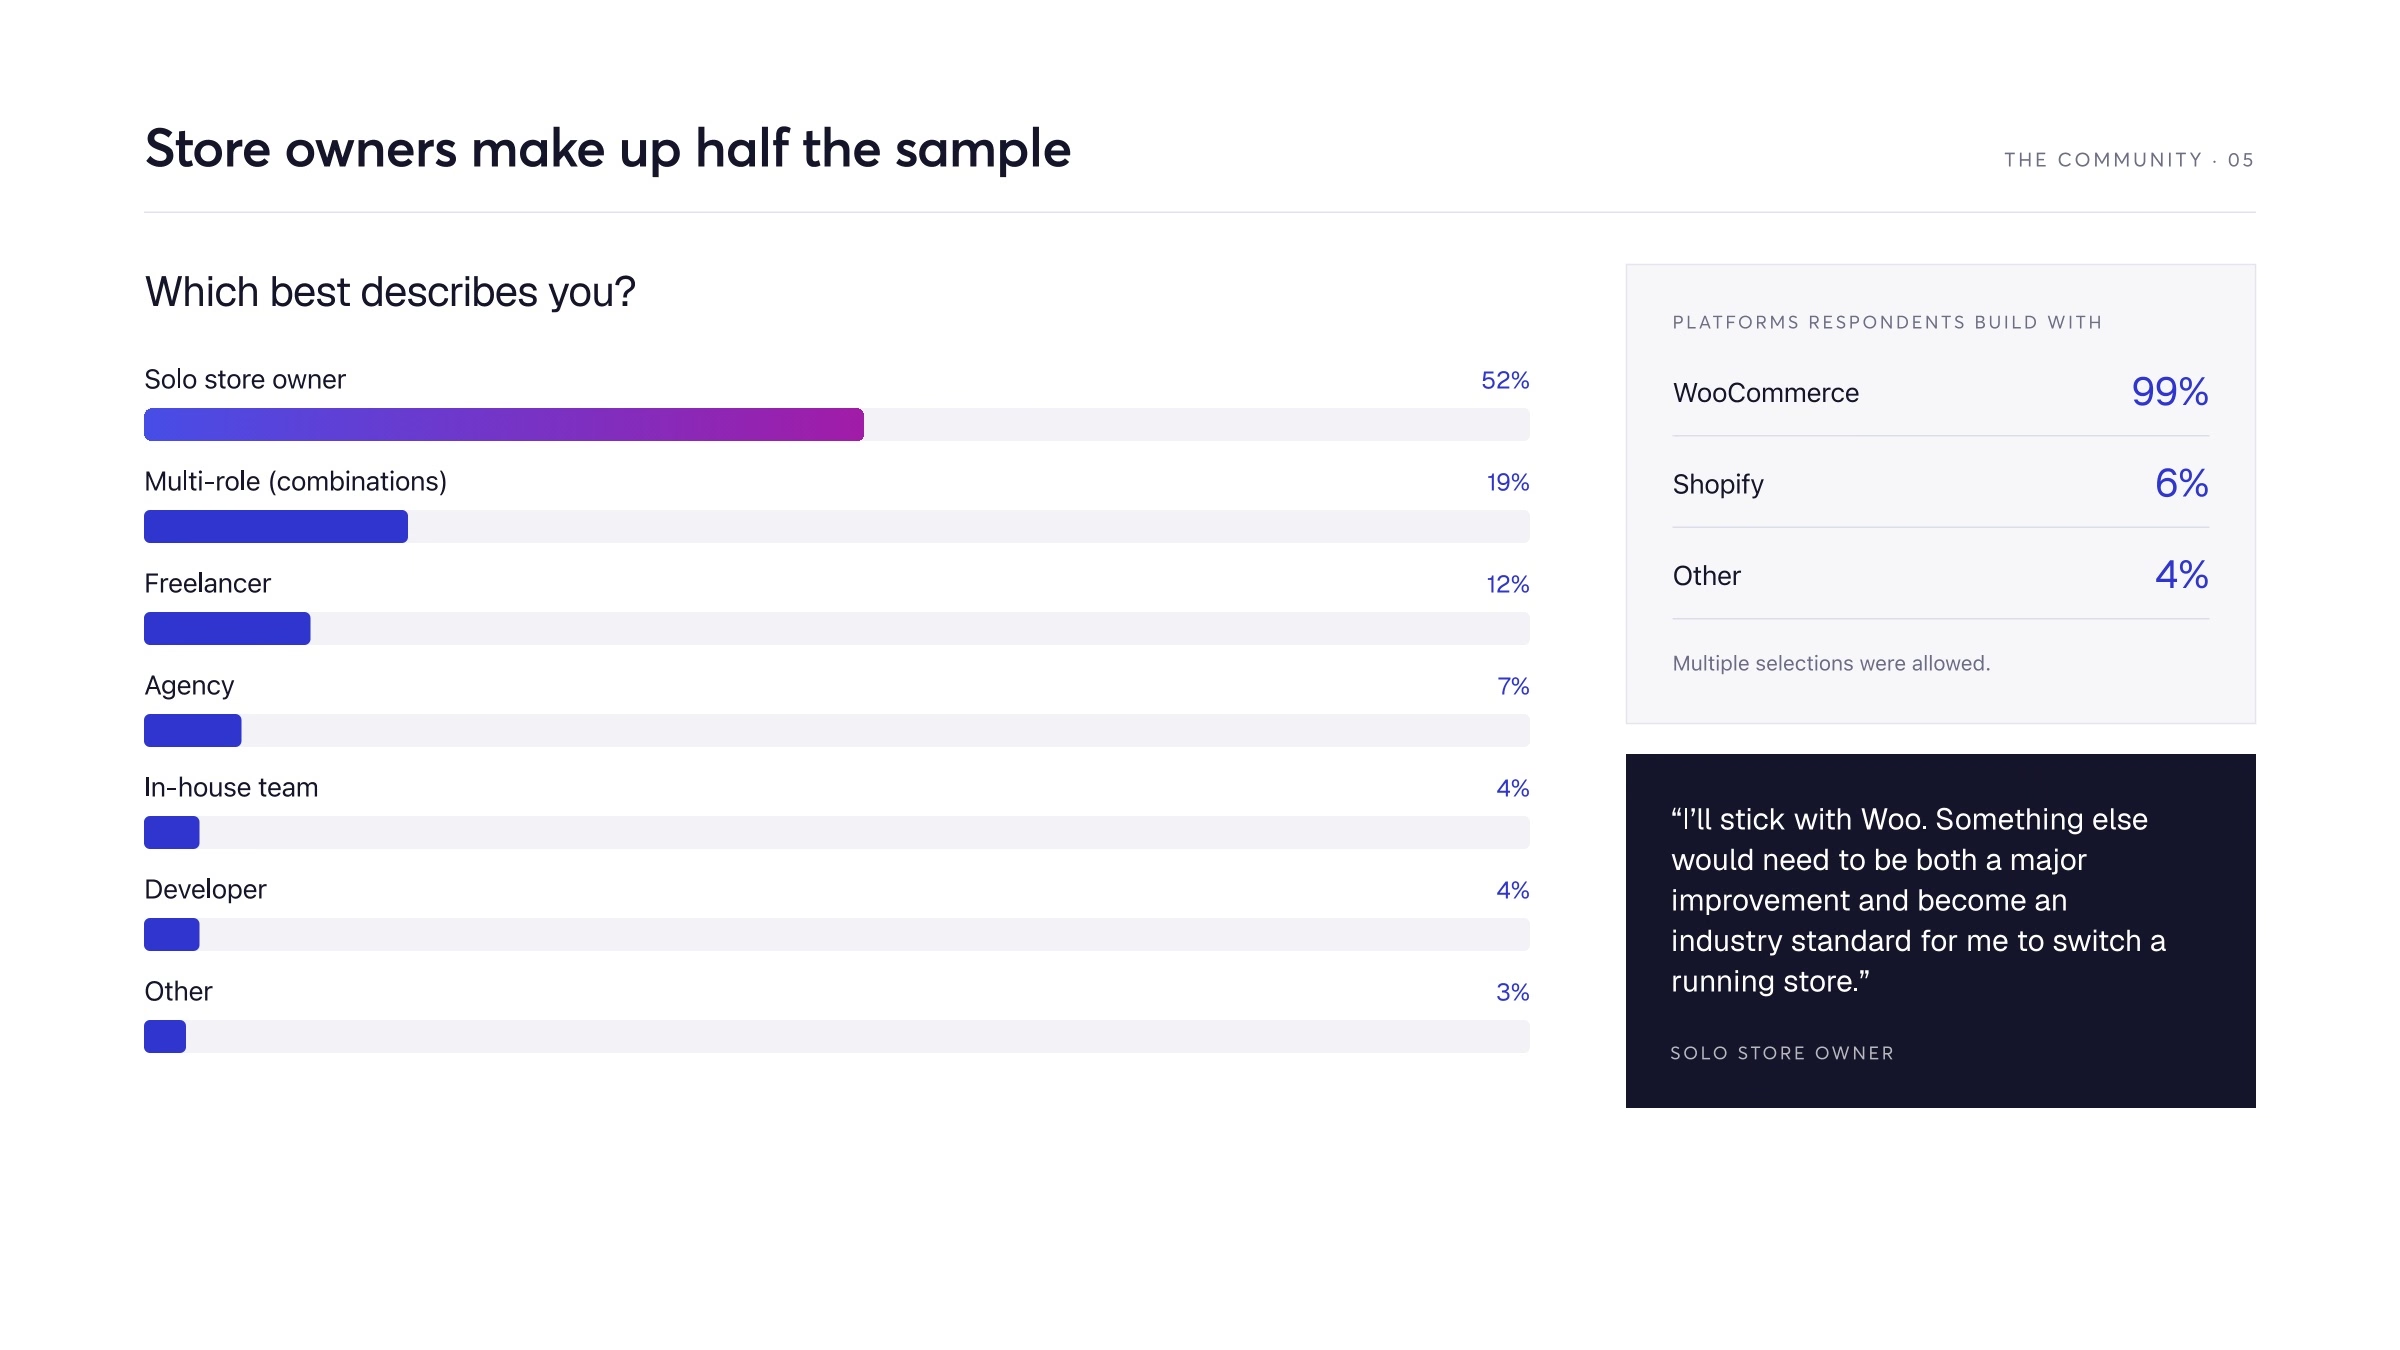
99% of respondents said they build eCommerce sites with WooCommerce; the question allowed multiple platforms.
The state of Woo: four signals
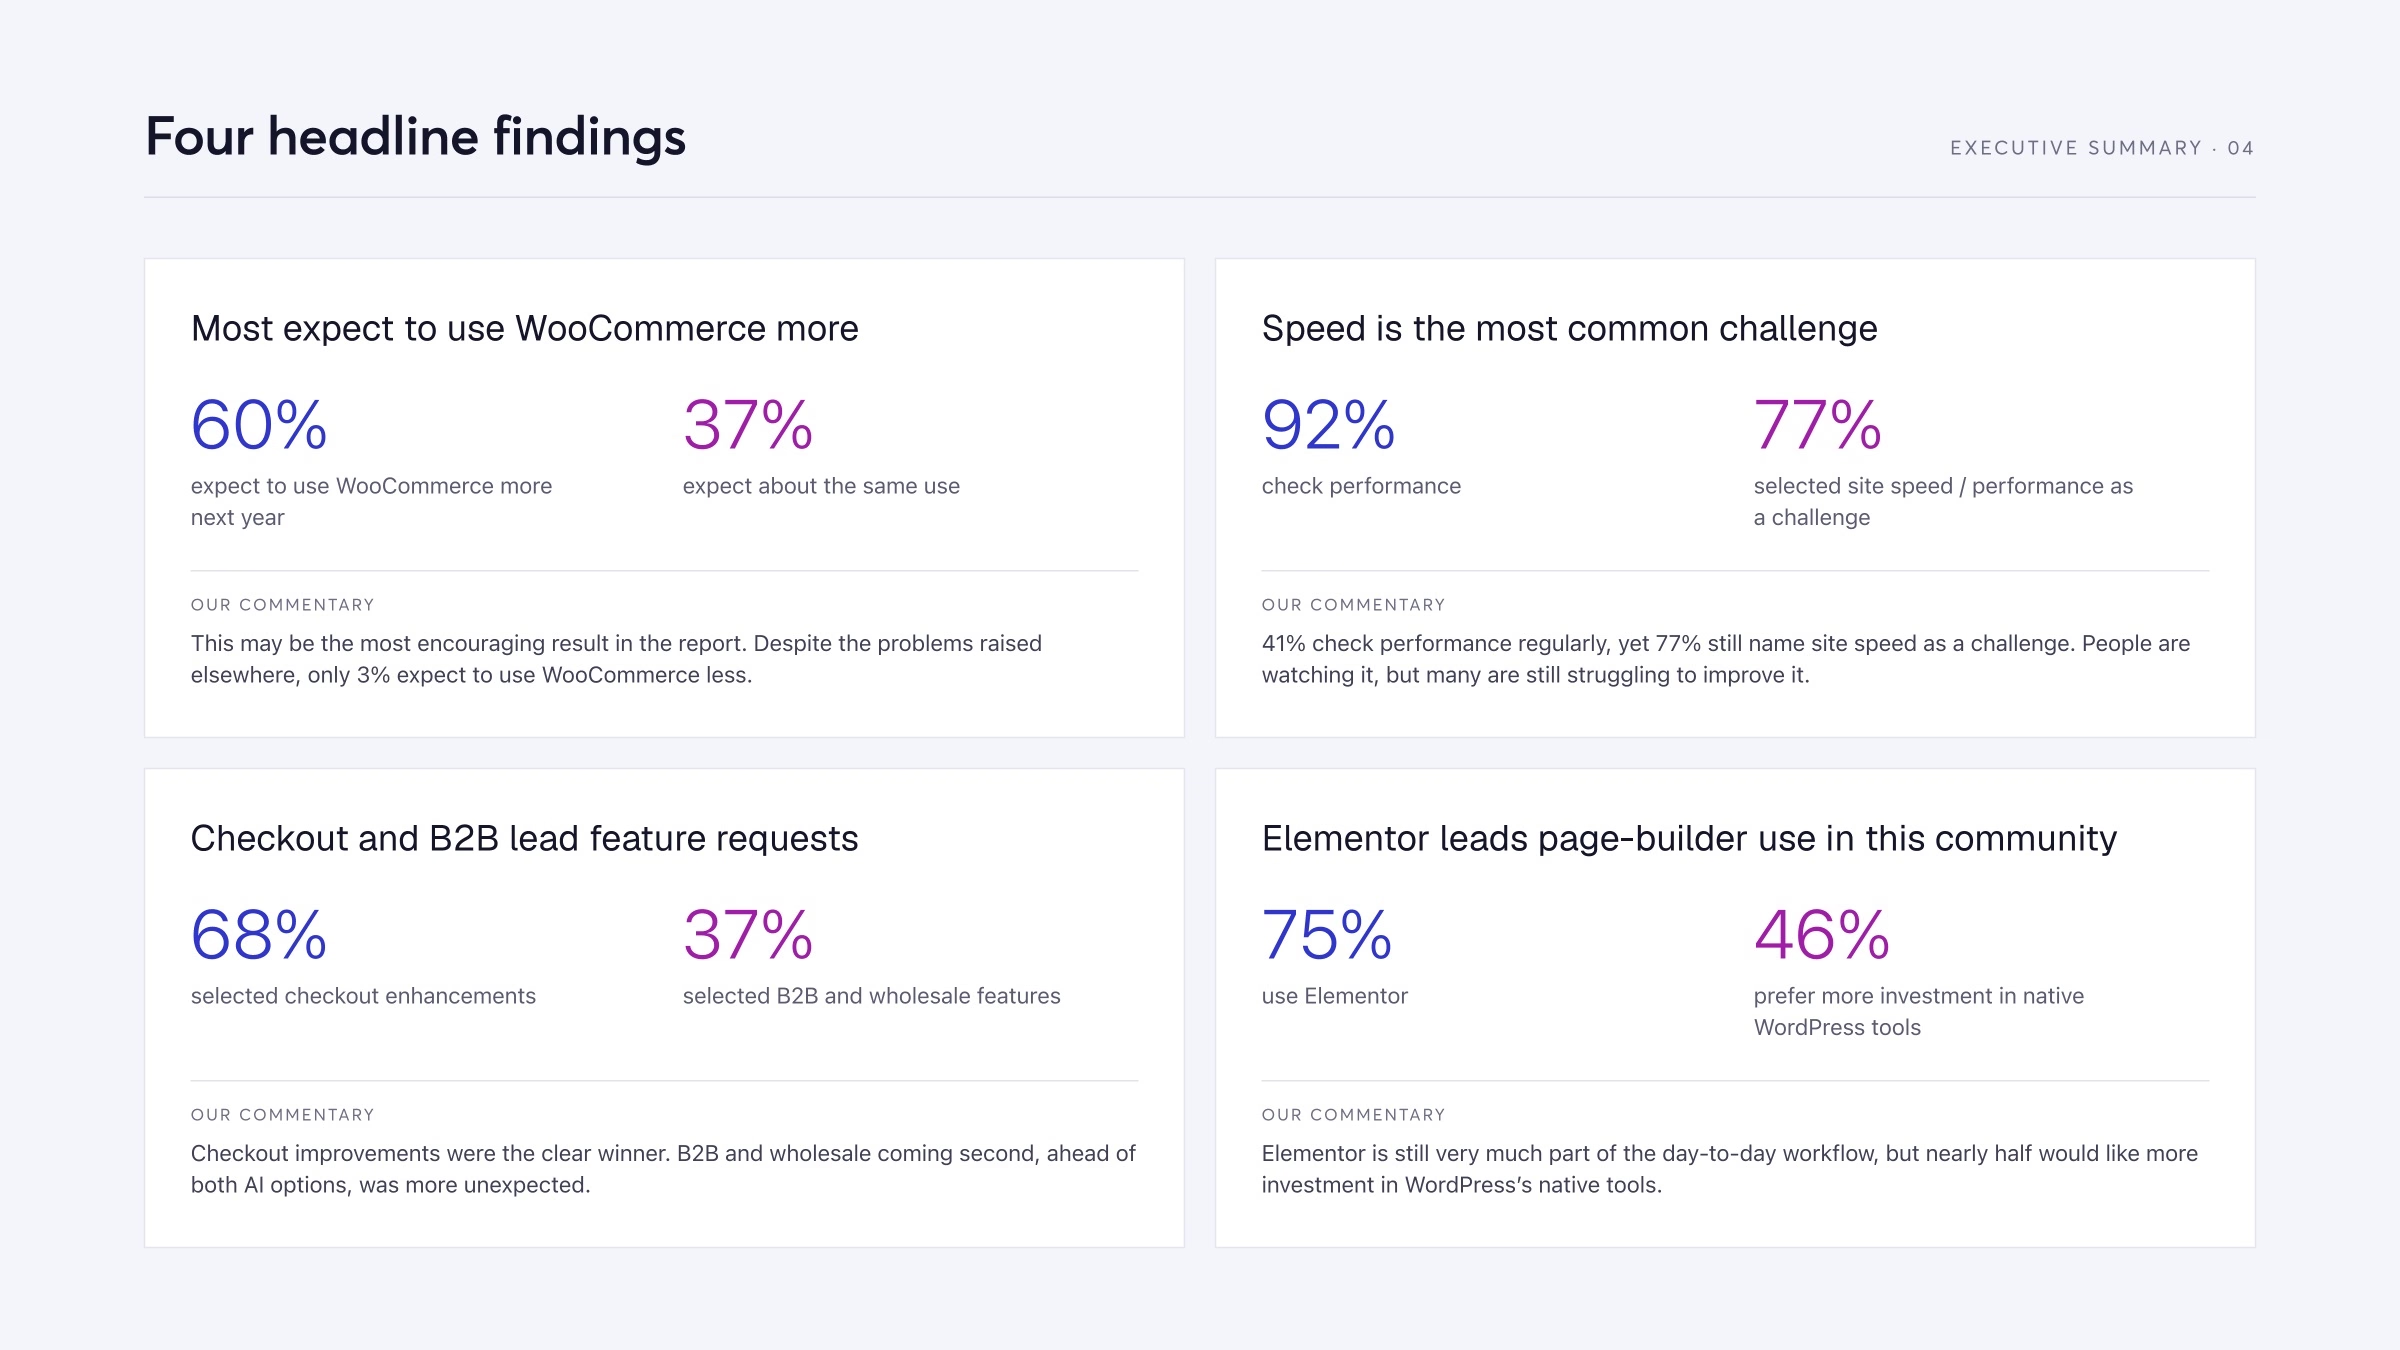
75% use Elementor, while 46% prefer a more native WordPress direction.
92% check performance, yet 77% still identify site speed as a challenge.
68% want checkout work and 37% want B2B features from CommerceGurus.
Who took part
52% identified as solo store owners, making them the largest group in the sample.
19% selected a combination of roles, while 12% identified as freelancers and 7% as agencies.
In-house teams and developers each represented 4% of respondents, with 3% selecting another role.
Editor adoption
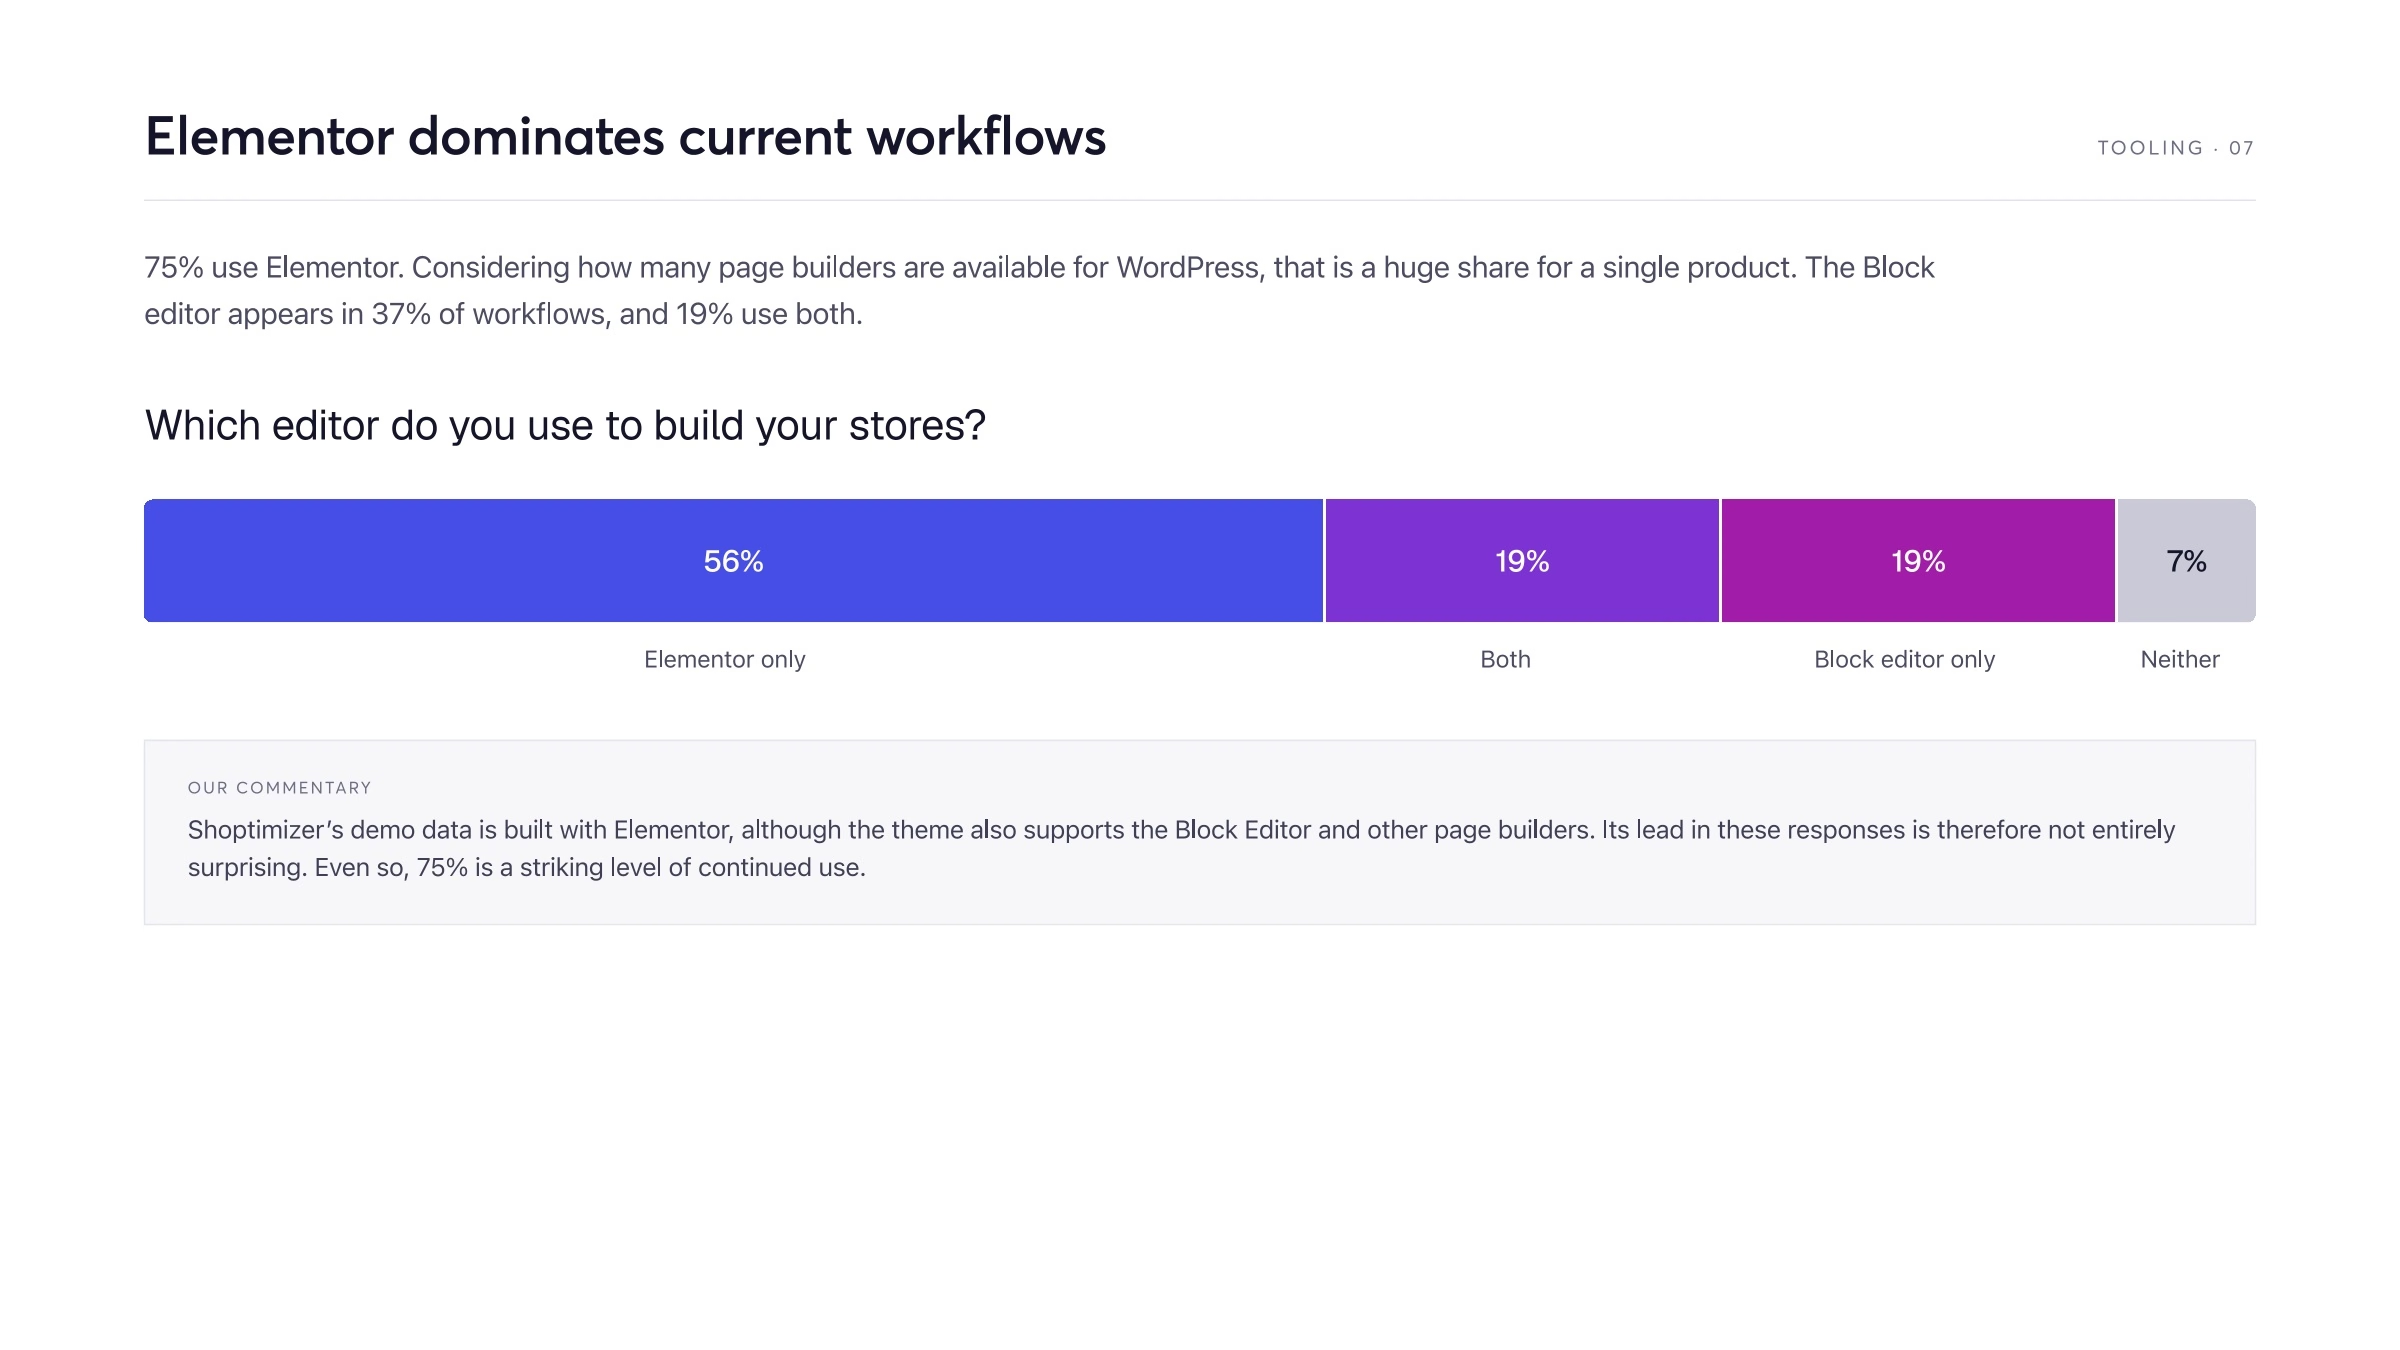
Elementor appears in 75% of respondents’ stacks, roughly twice the 37% reach of the native Block editor.
56% use Elementor without the Block editor, while 19% use the Block editor without Elementor.
19% use both Elementor and the Block editor, and 7% use neither.
Preferred direction for page-builders
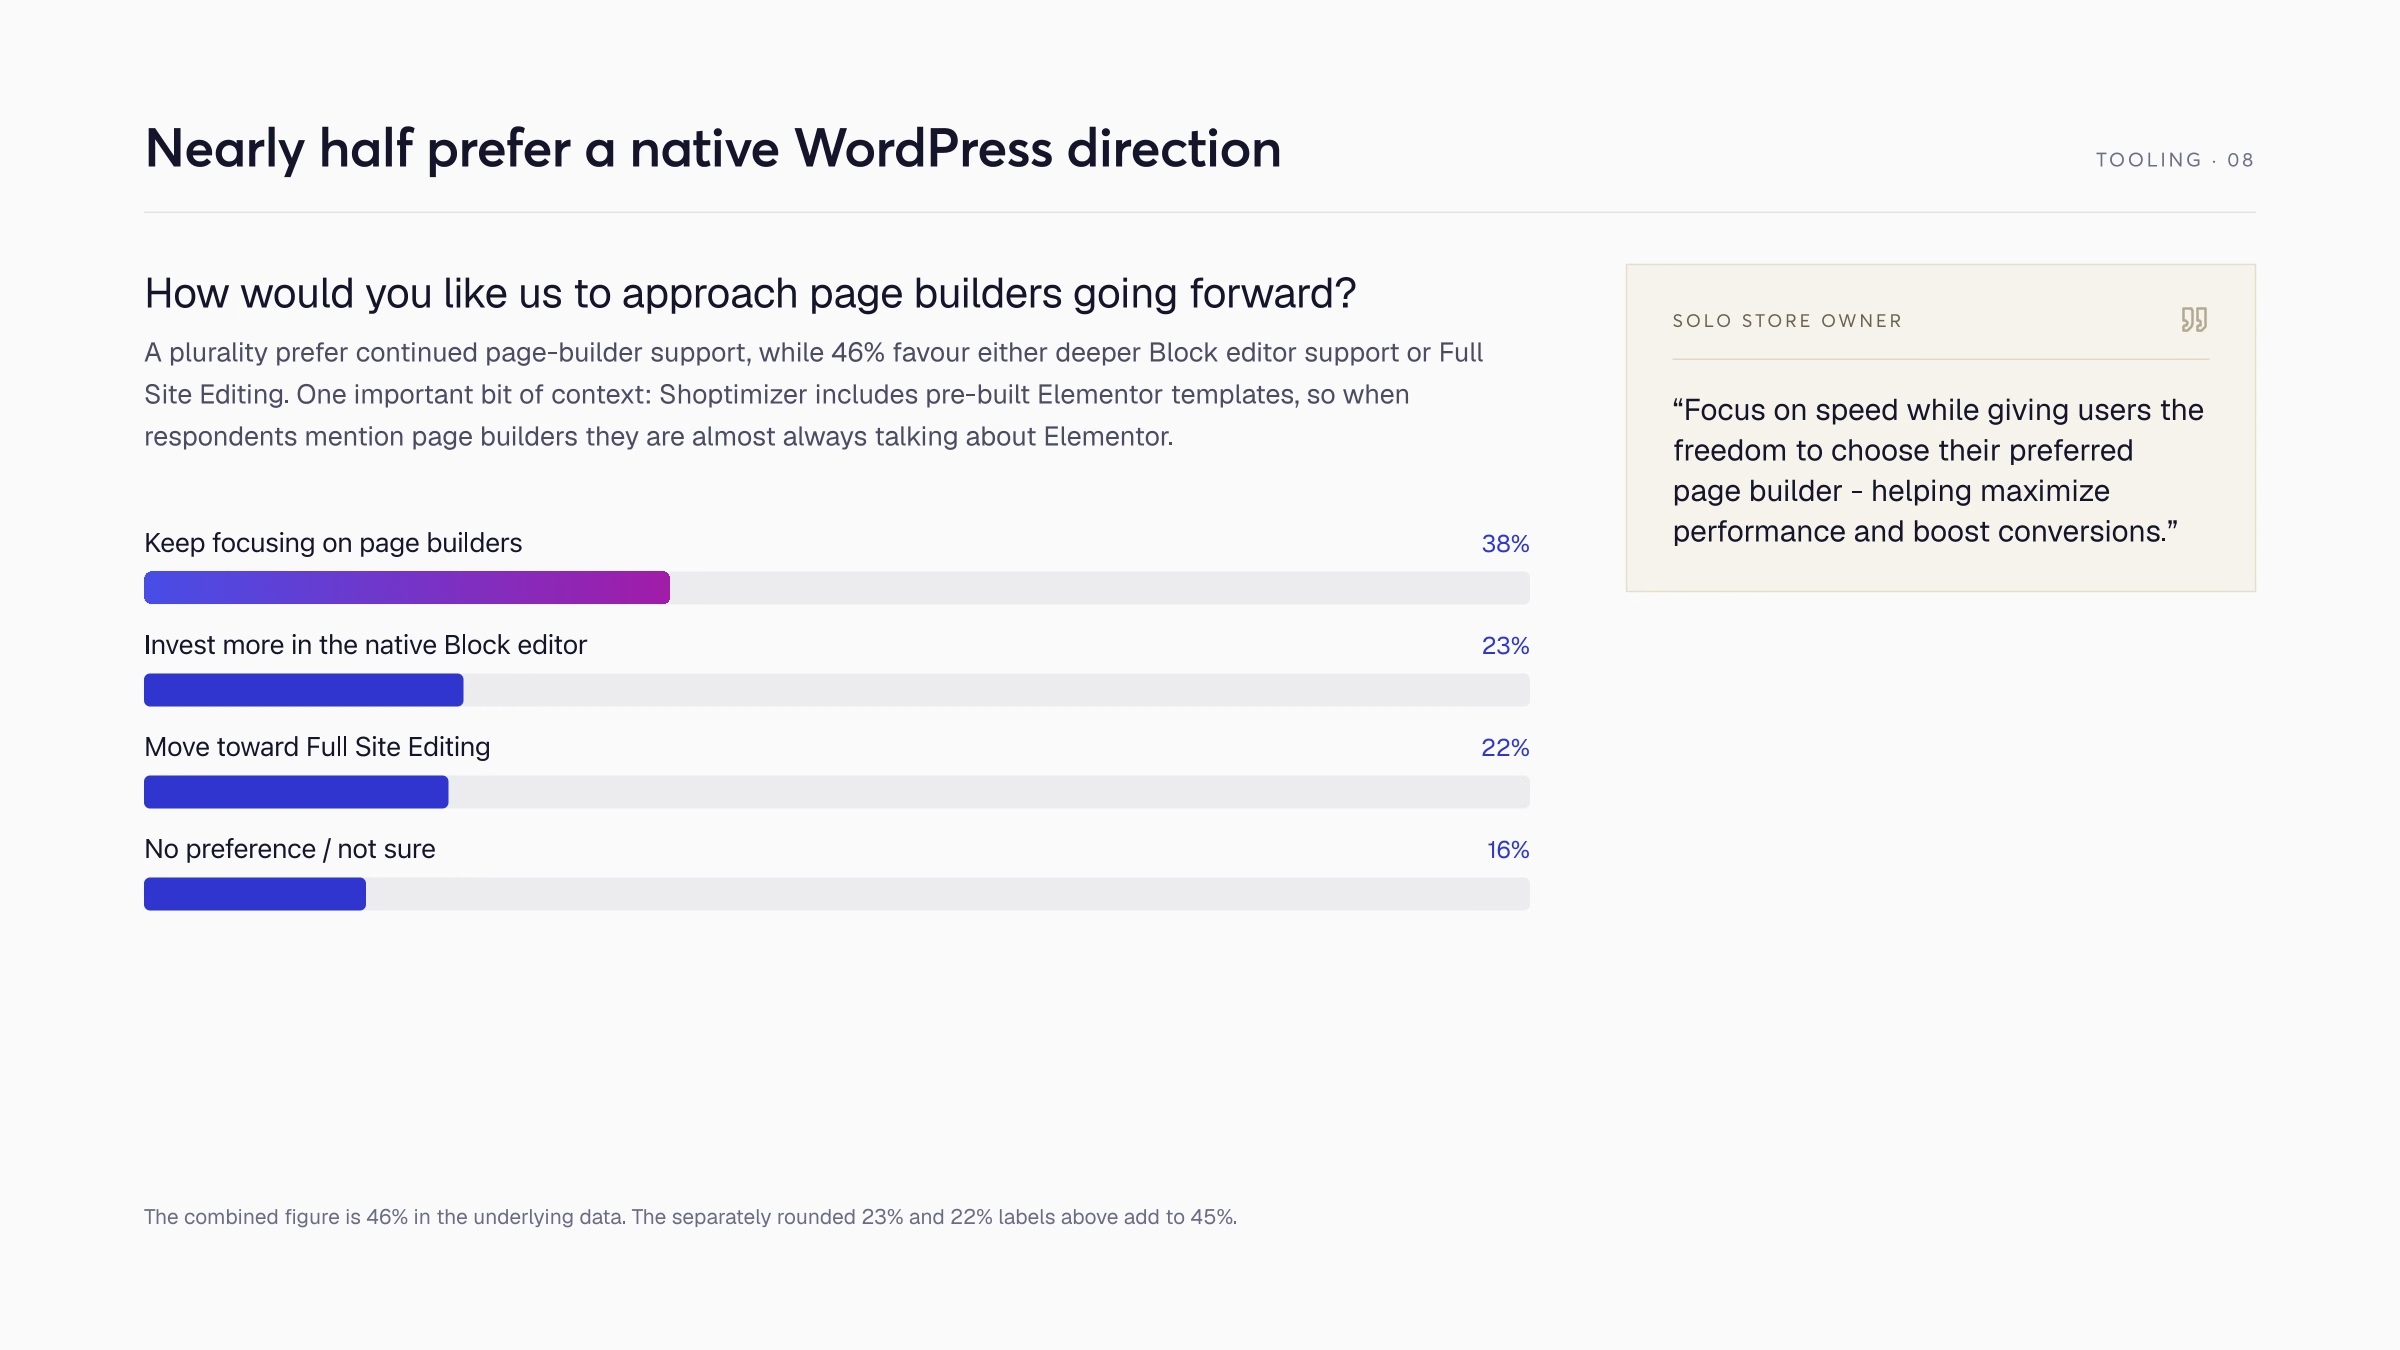
46% favour a more native WordPress direction, combining deeper Block editor support and Full Site Editing in the underlying data.
38% want CommerceGurus to keep focusing on page builders, the largest single response.
Separately rounded results show 23% favouring more Block editor investment, 22% Full Site Editing, and 16% unsure.
Current editor use
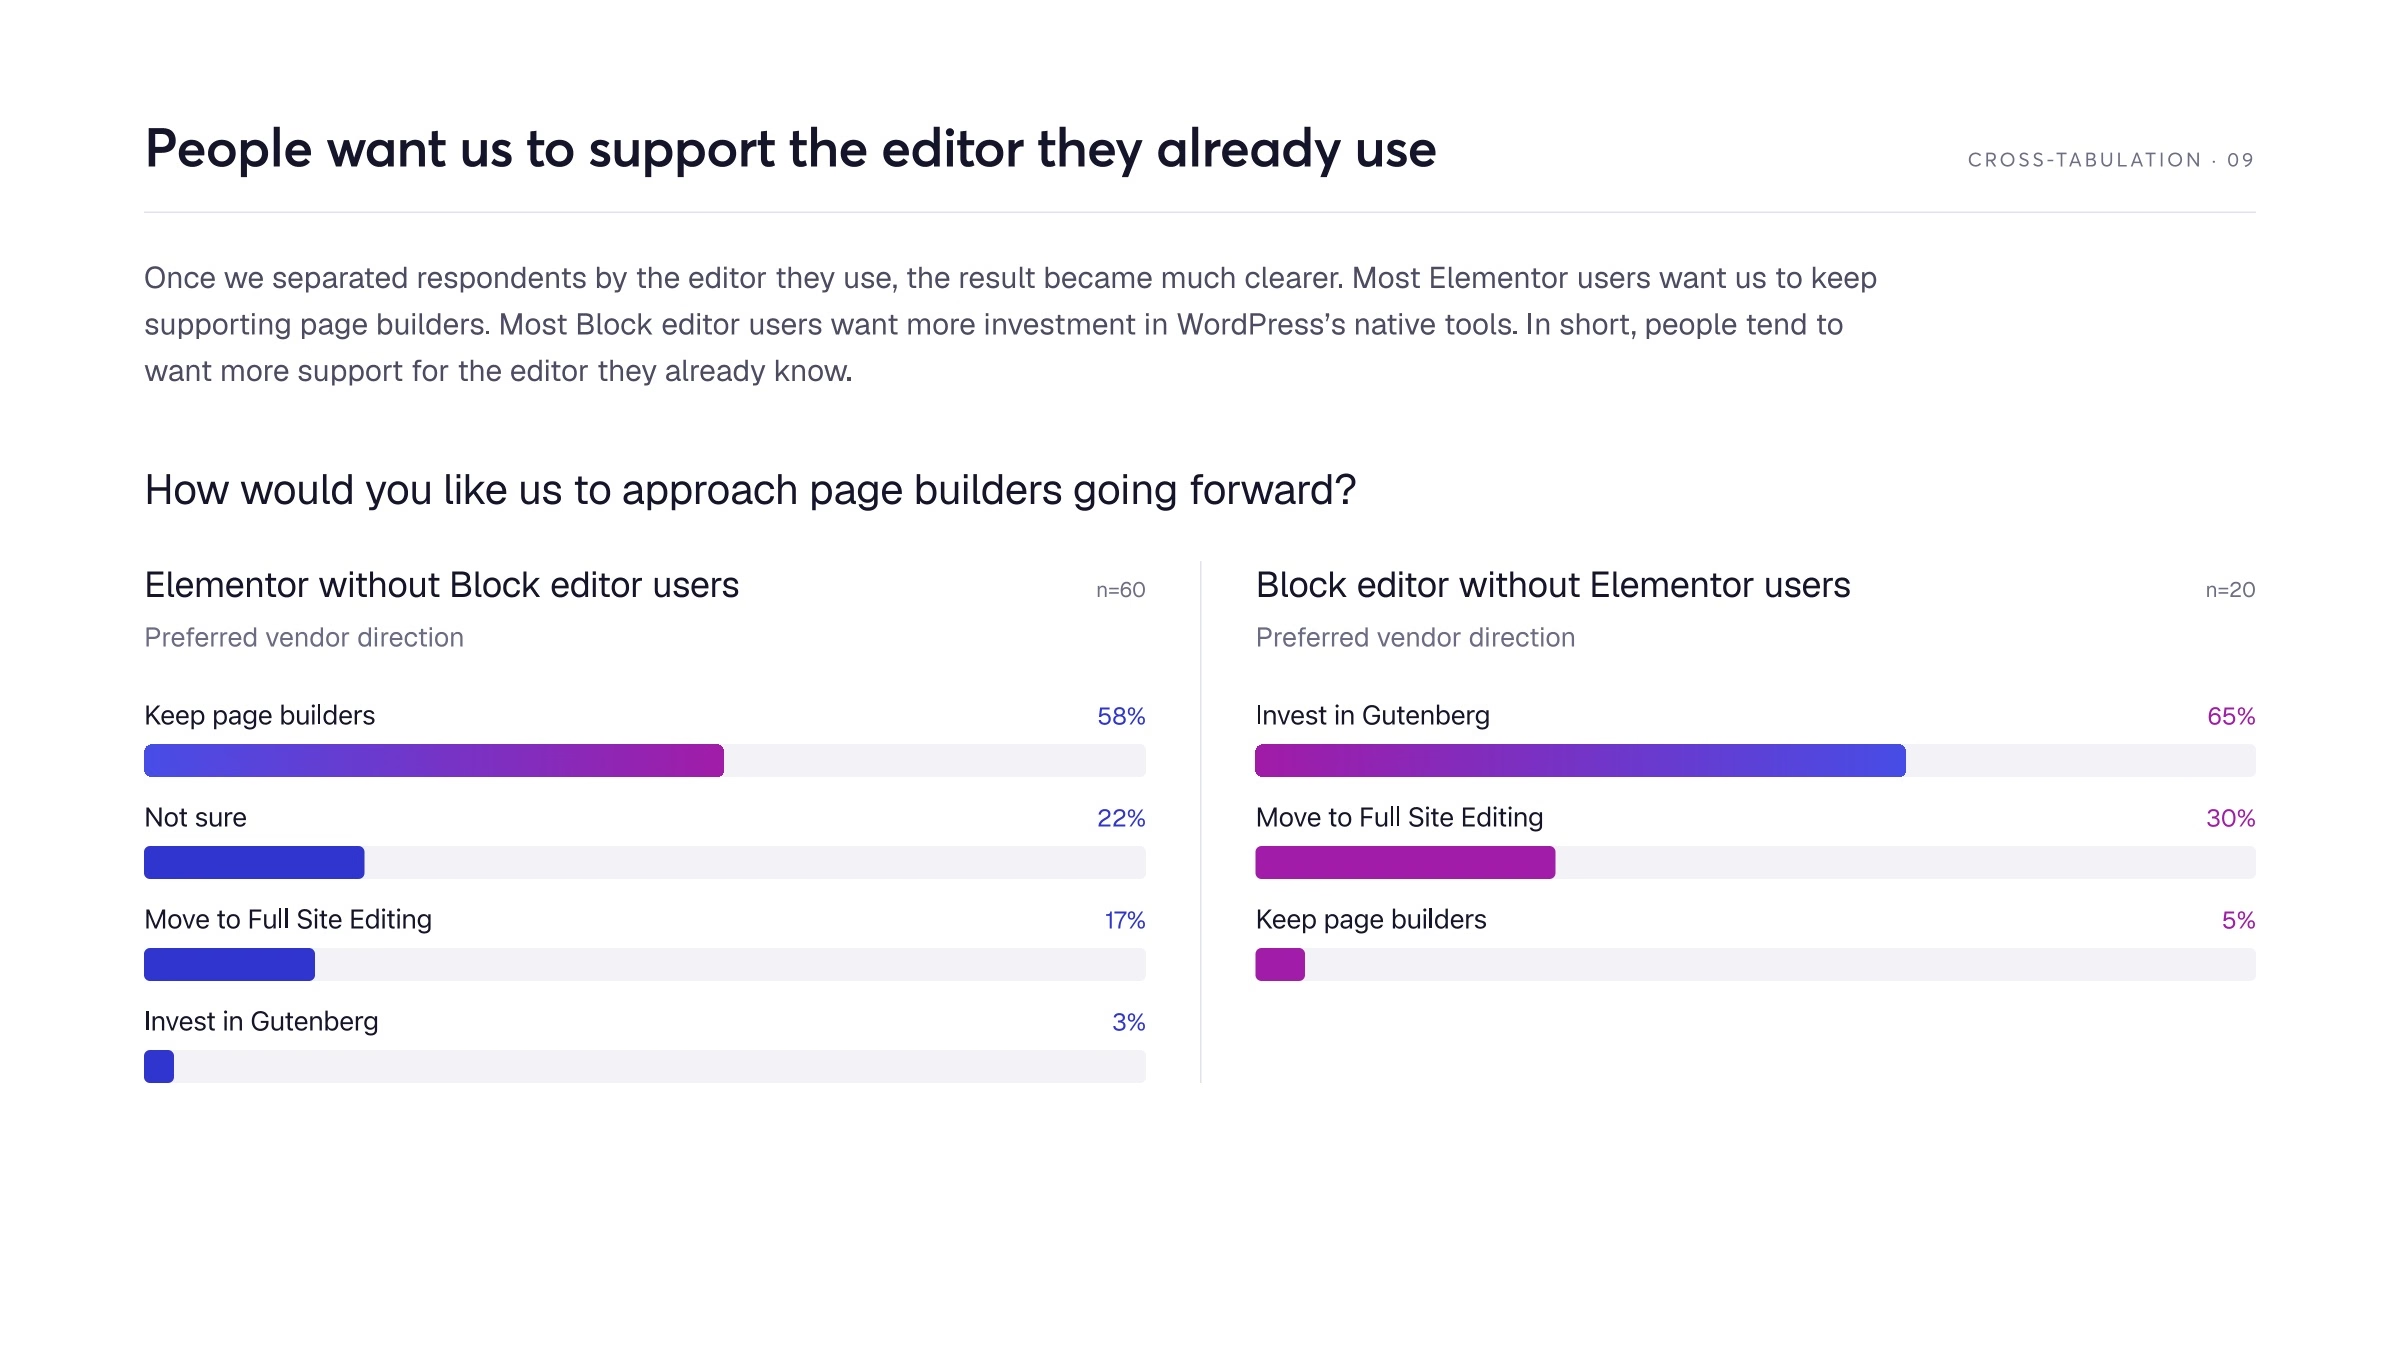
Among Elementor users who do not use the Block editor, 58% want continued page-builder support, 22% are unsure, 17% favour Full Site Editing, and 3% want greater Gutenberg investment.
Among Block editor users who do not use Elementor, 65% want greater Gutenberg investment, 30% favour Full Site Editing, and 5% want continued page-builder support.
Store speed and performance monitoring
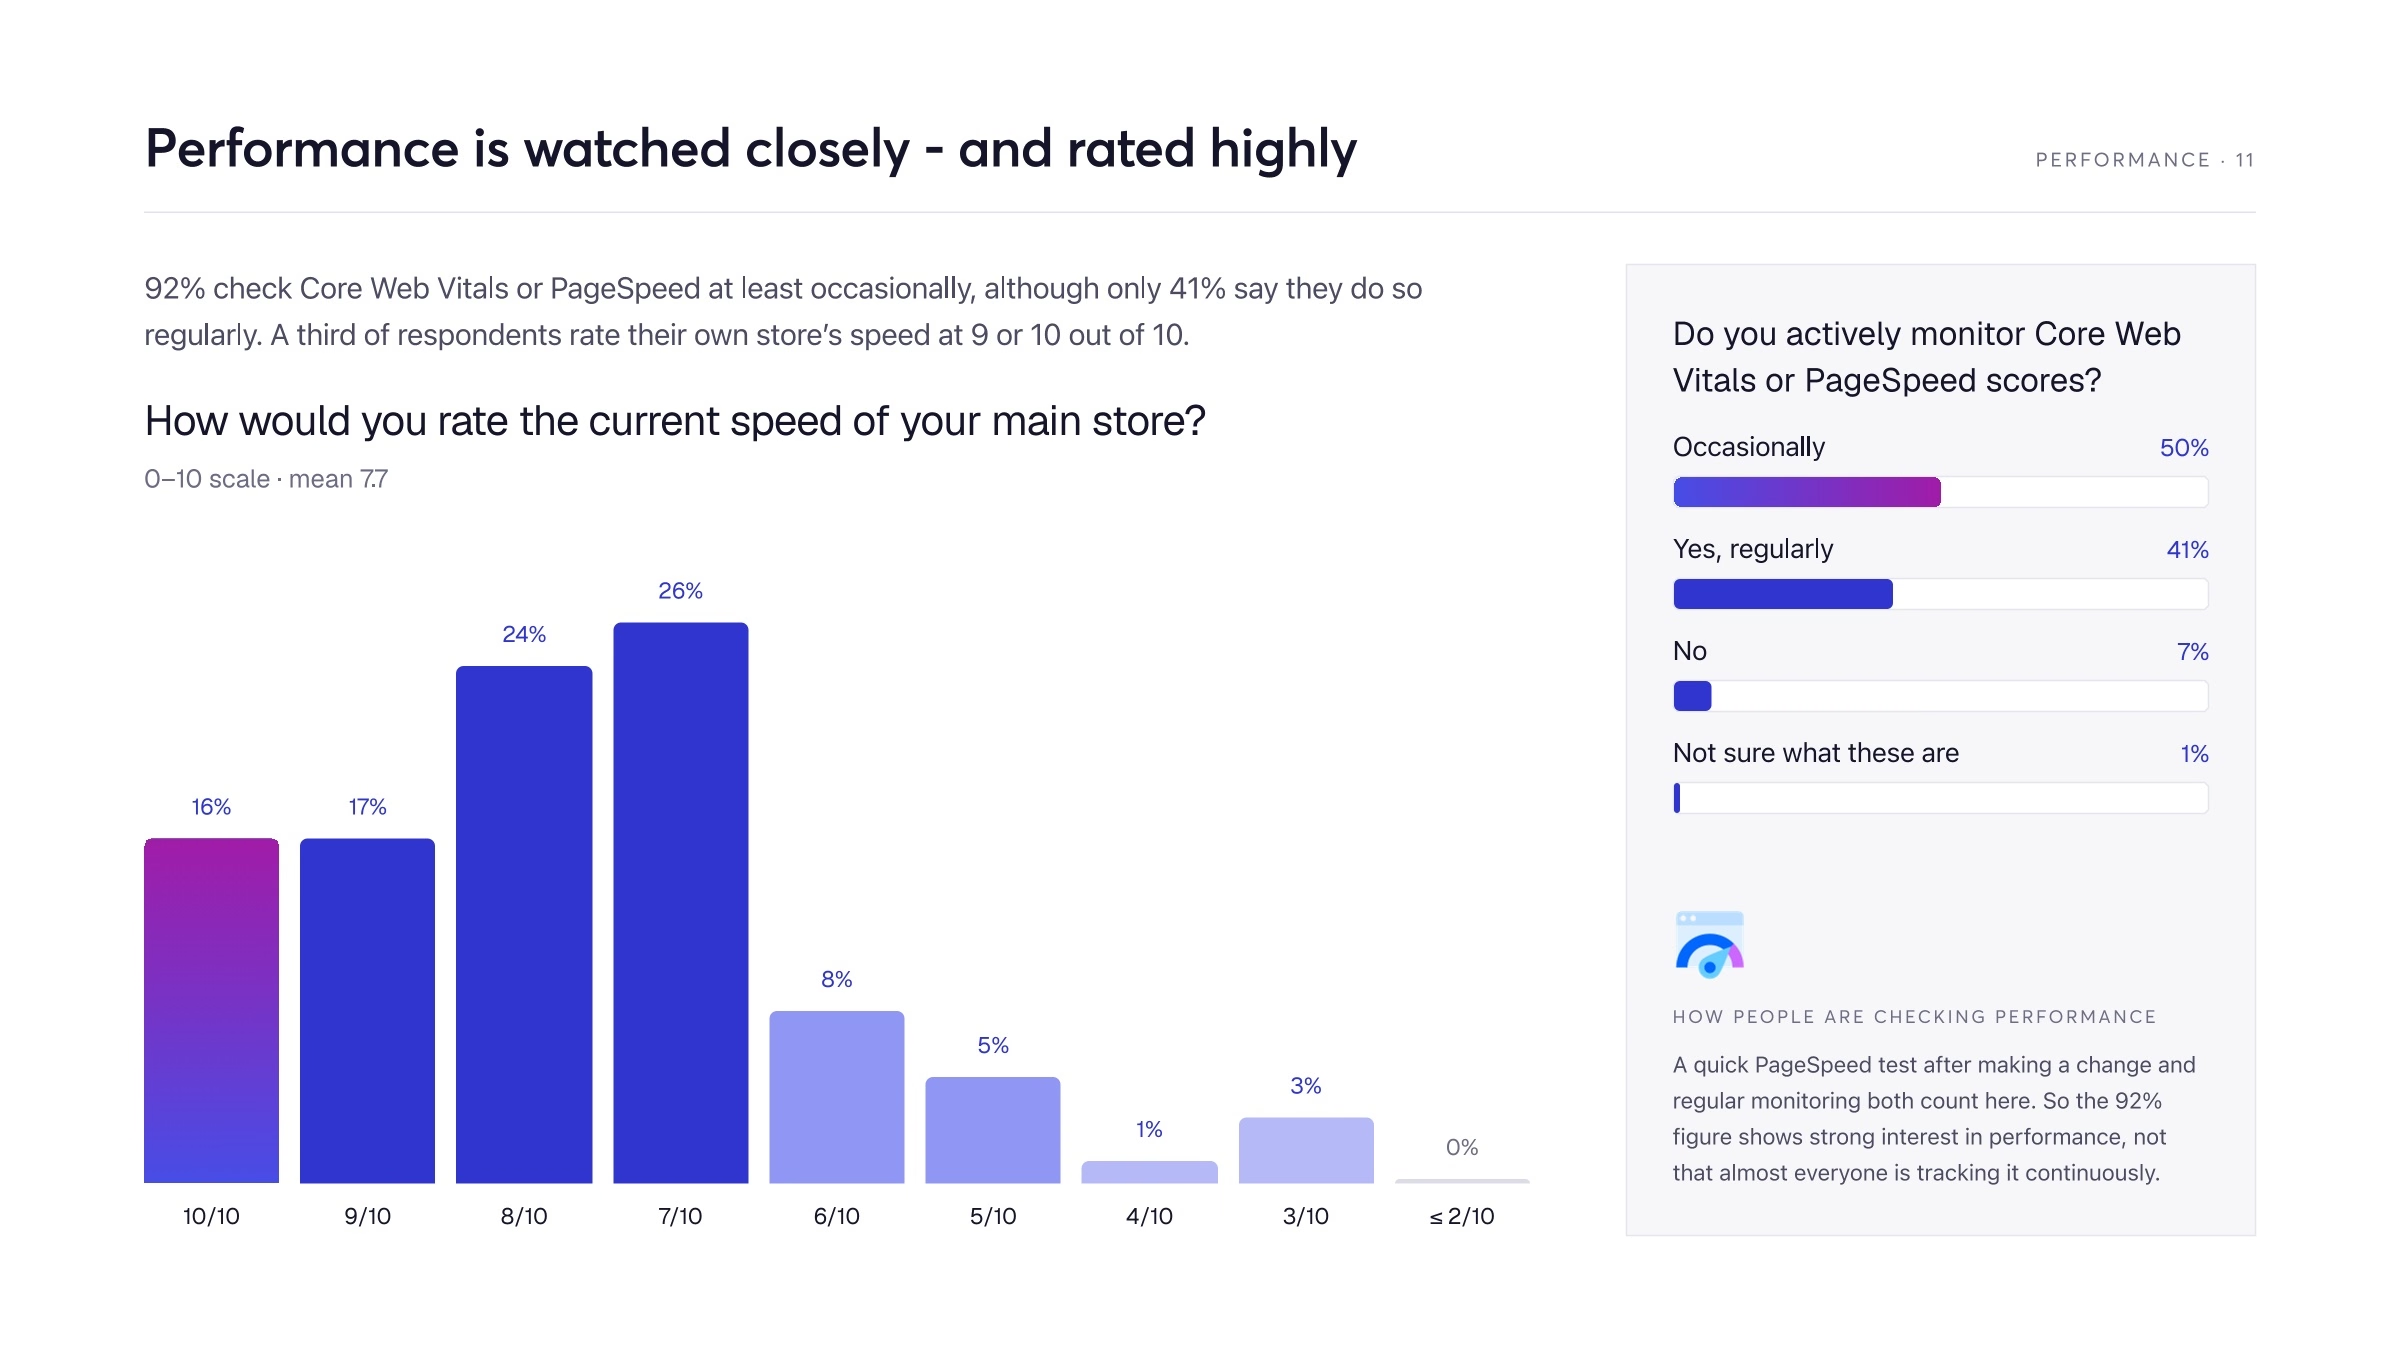
Respondents rated the speed of their main store at a mean of 7.7 out of 10.
33% rated their store’s speed at 9 or 10 out of 10, while no respondent selected 0, 1 or 2.
Store-speed ratings clustered around 7 and 8: 26% selected 7 and 24% selected 8.
Underlying data show 92% check Core Web Vitals or PageSpeed at least occasionally; separately rounded categories show 50% occasionally and 41% regularly.
7% do not monitor Core Web Vitals or PageSpeed, while 1% were unsure what they are.
Performance plugins
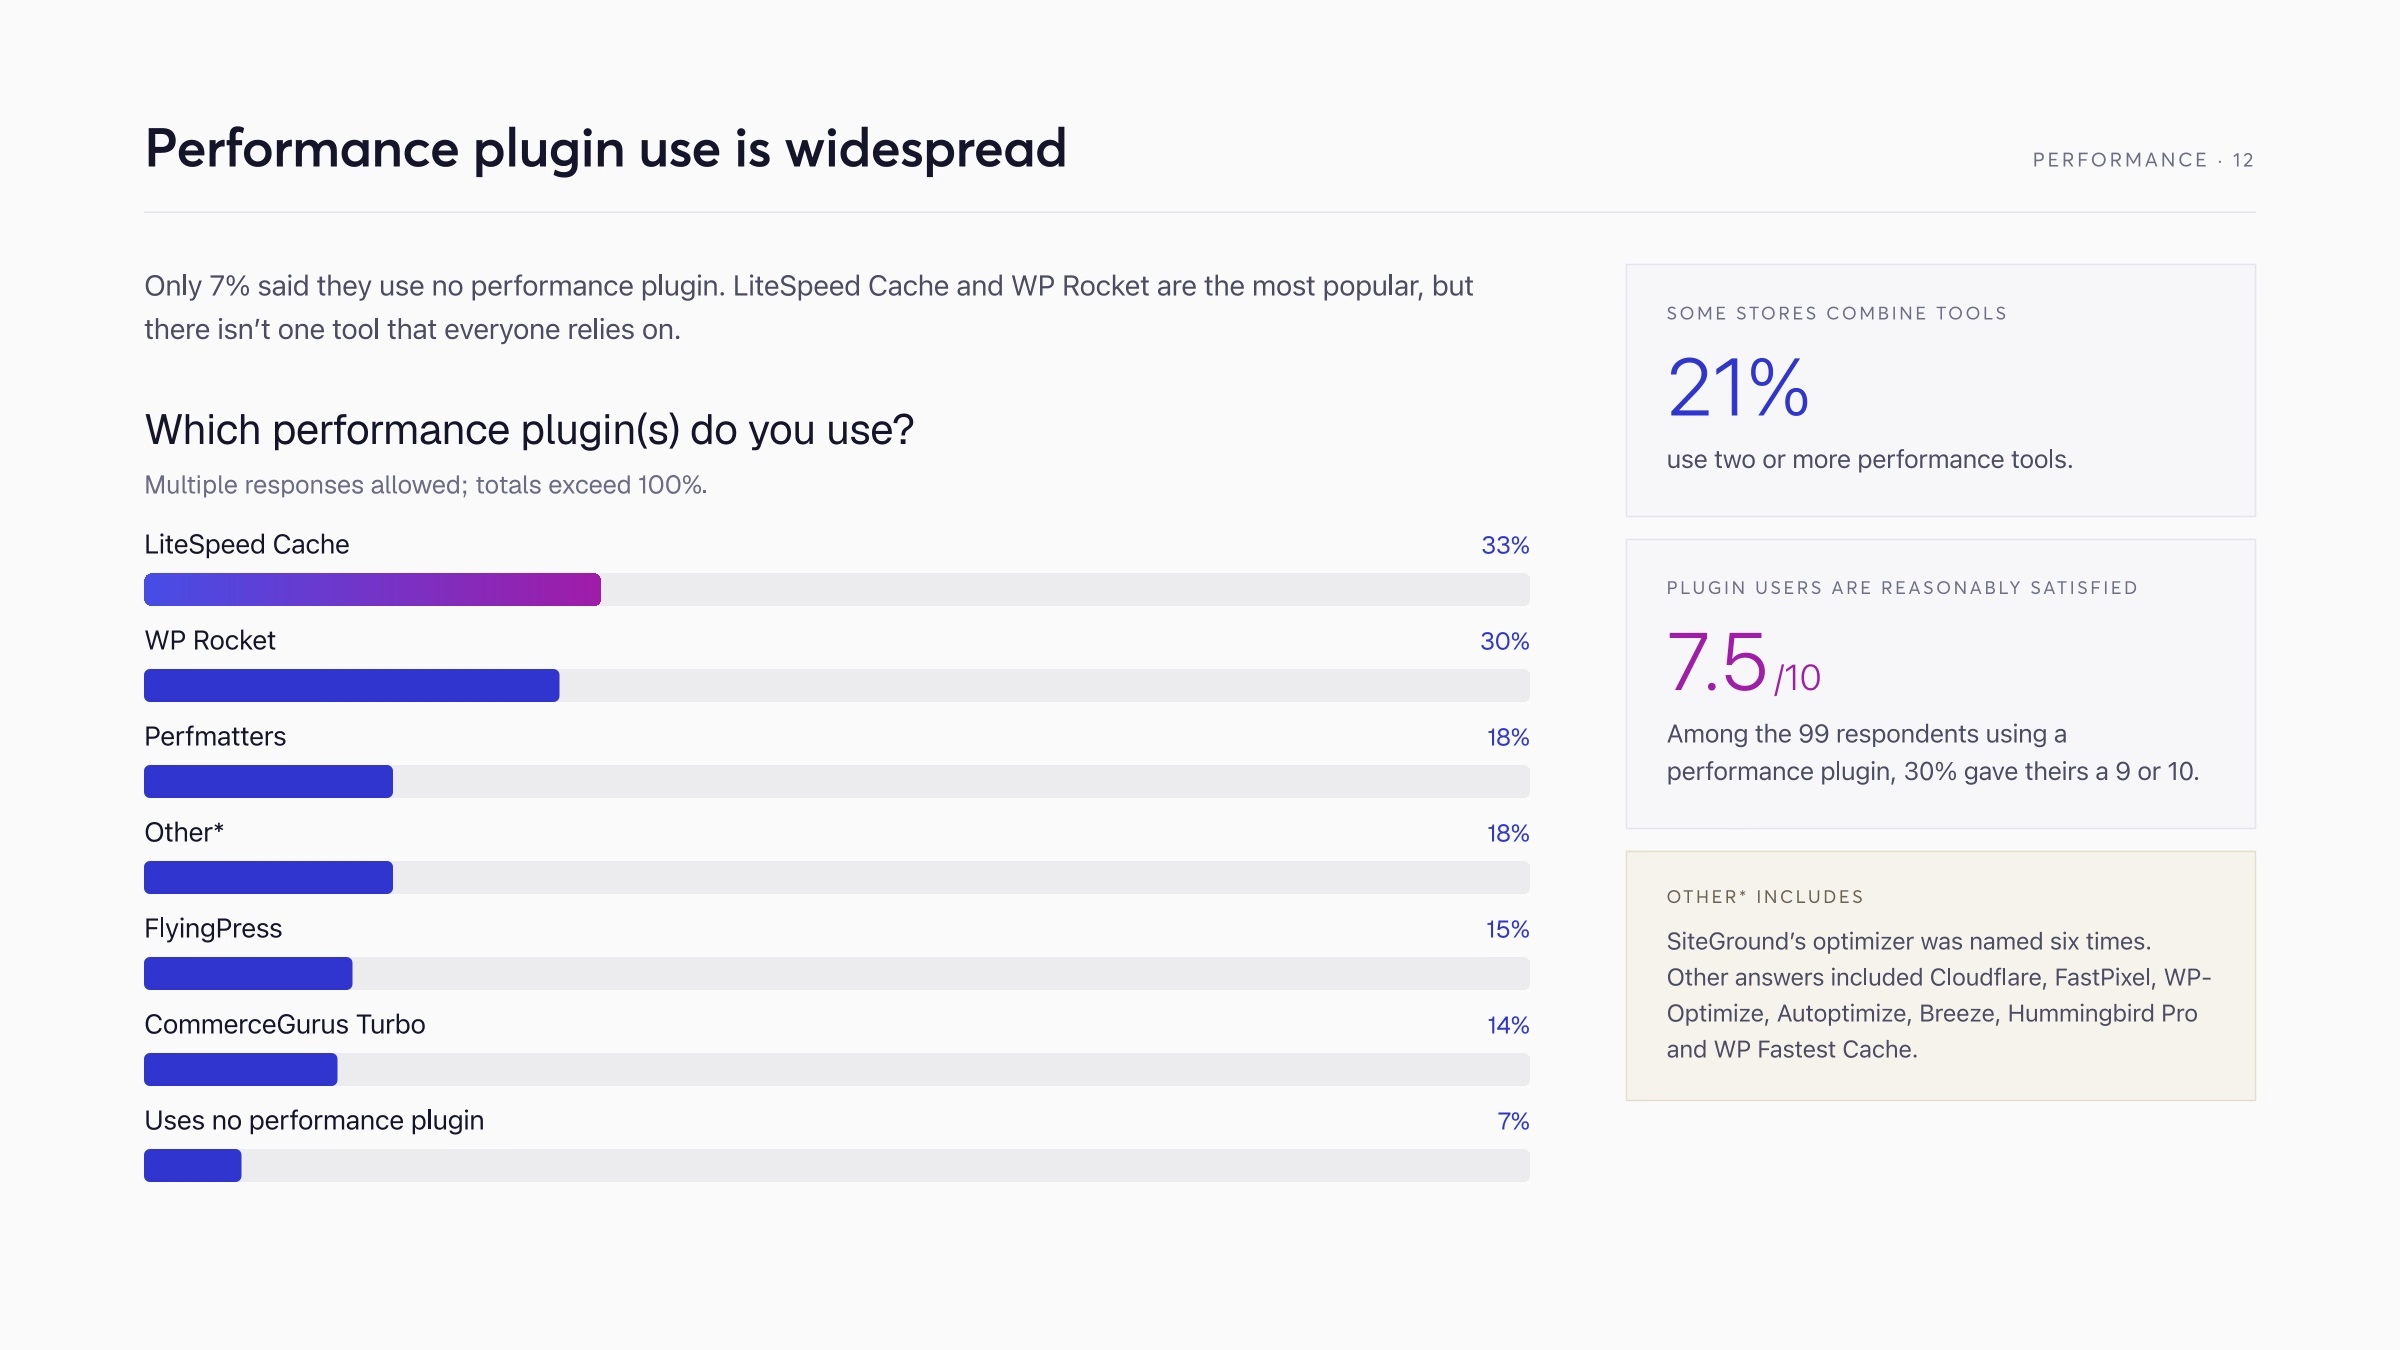
93% use at least one performance plugin; 21% selected two or more tools.
LiteSpeed Cache leads at 33%, followed by WP Rocket at 30%.
Perfmatters and other plugins each appear in 18% of responses, followed by FlyingPress at 15% and CommerceGurus Turbo at 14%.
Among 99 performance-plugin users, the mean satisfaction rating was 7.5 out of 10, and 30% gave their tool a 9 or 10.
7% said they use no performance plugin.
WooCommerce in respondents’ own words
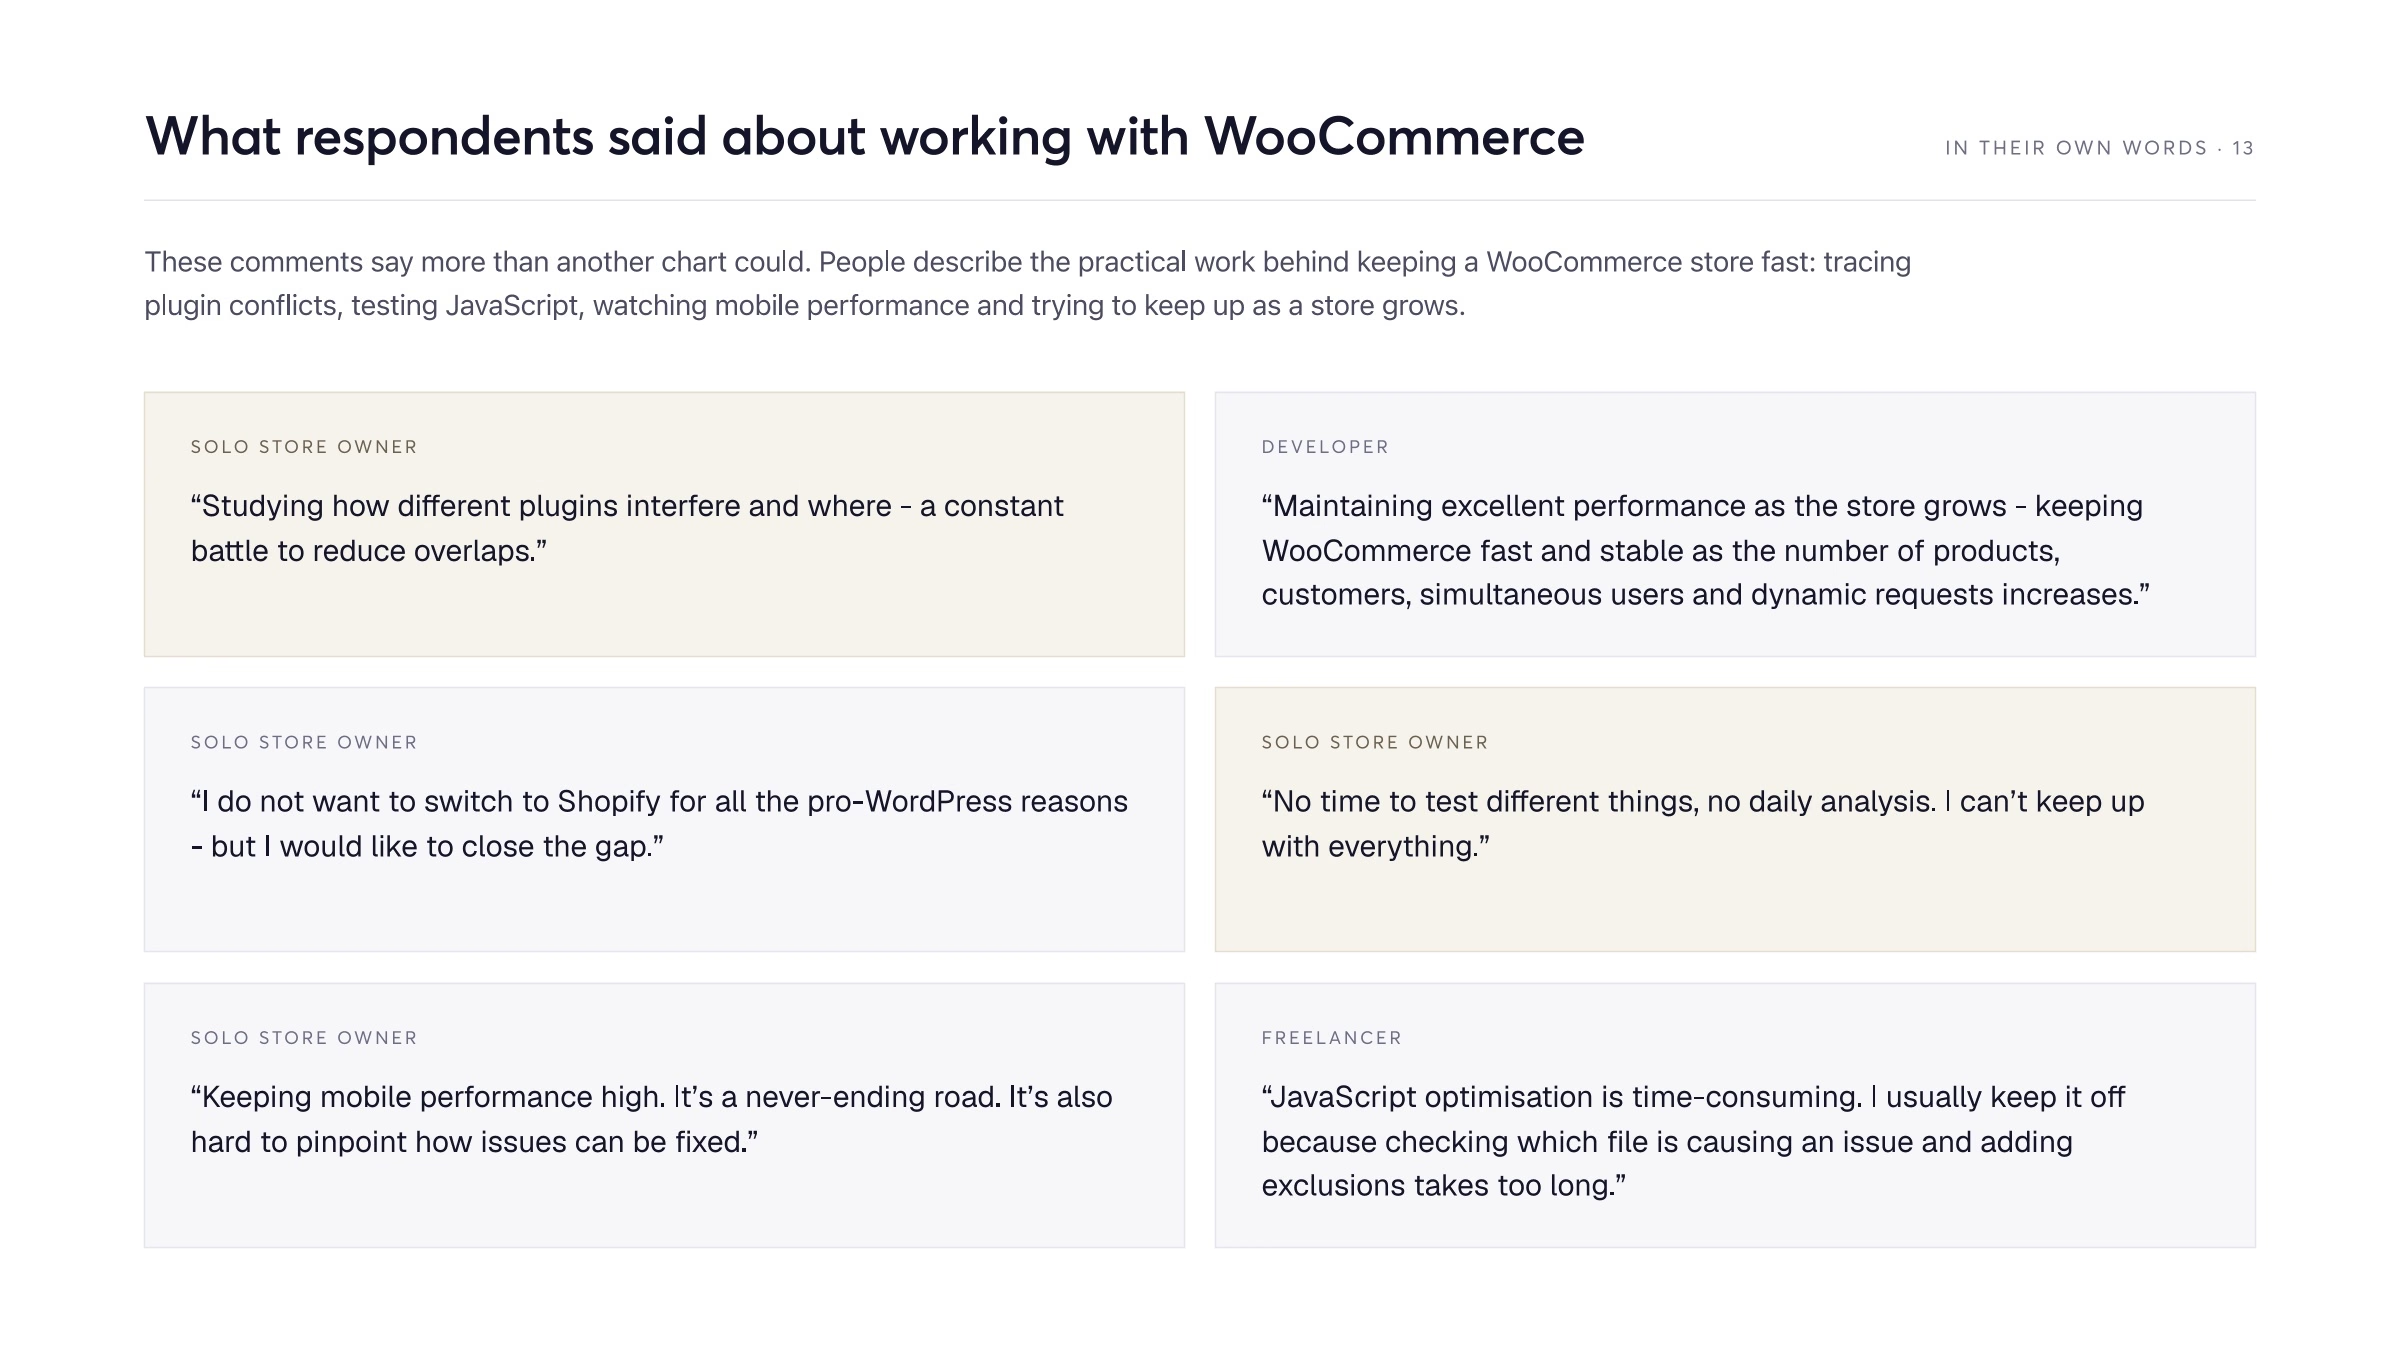
Written responses raised plugin interaction, performance at scale, the gap with hosted platforms, limited time, mobile performance, and JavaScript optimisation.
Biggest challenges
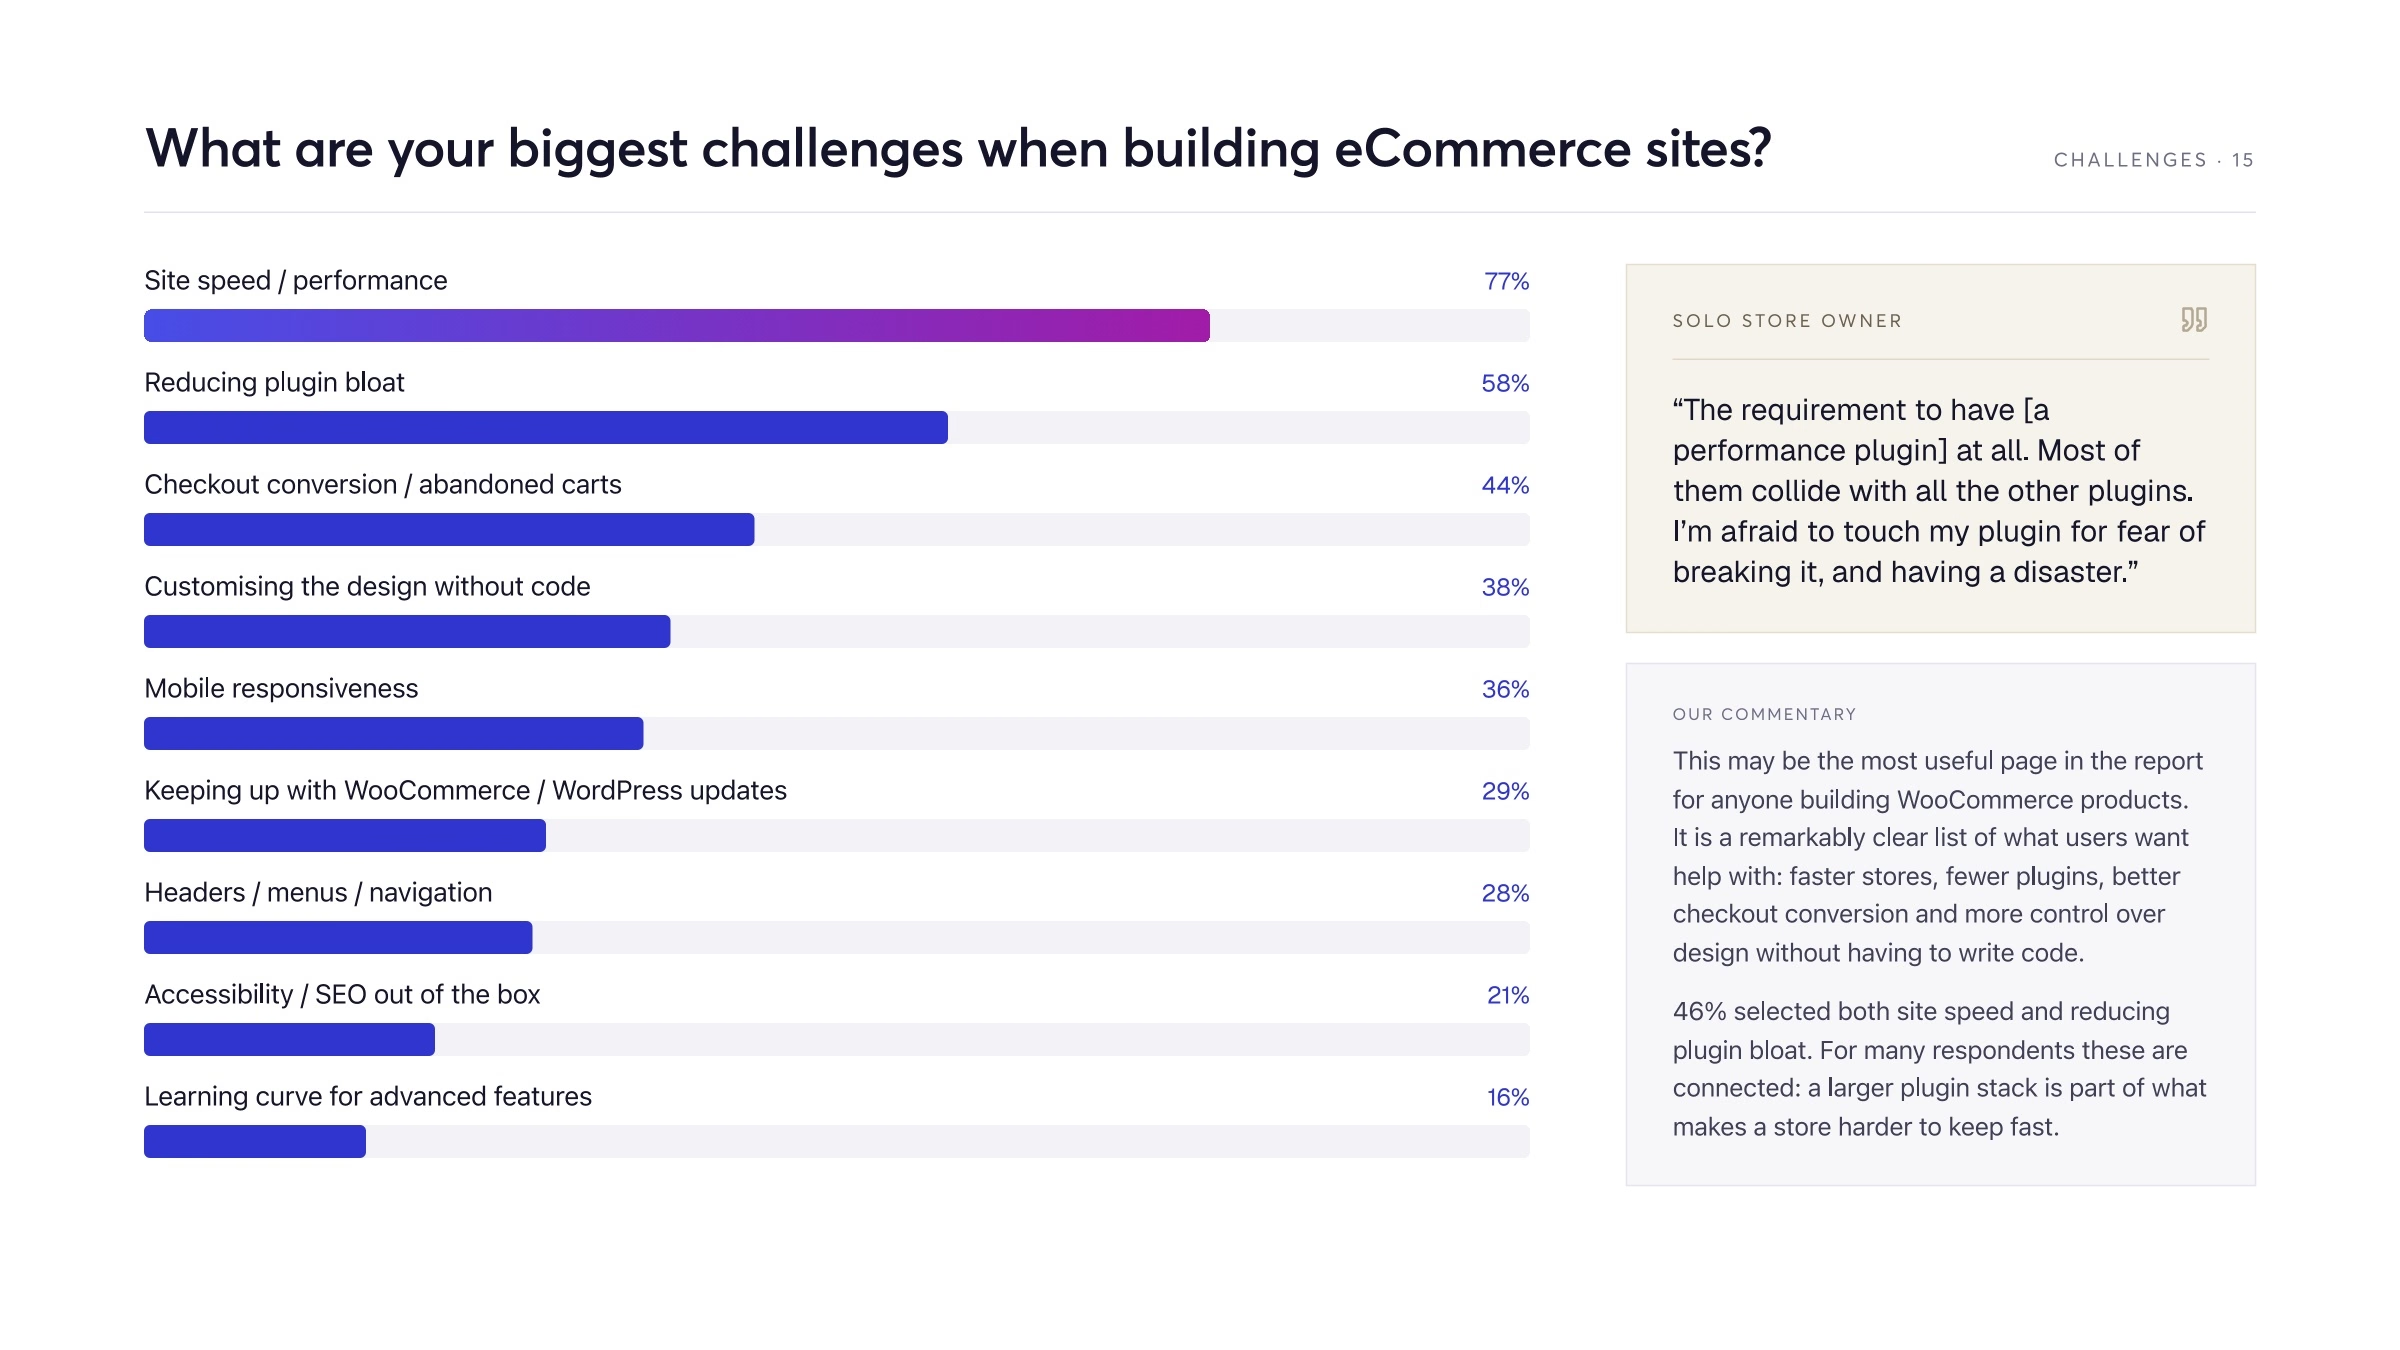
77% selected site speed or performance as a challenge, the highest result in the survey.
58% selected reducing plugin bloat, while 44% selected checkout conversion or abandoned carts.
Design customisation without code was selected by 38%, mobile responsiveness by 36%, and keeping up with updates by 29%.
Headers, menus or navigation were selected by 28%, accessibility or SEO out of the box by 21%, and the learning curve for advanced features by 16%.
46% selected both site speed and reducing plugin bloat.
Challenges by role
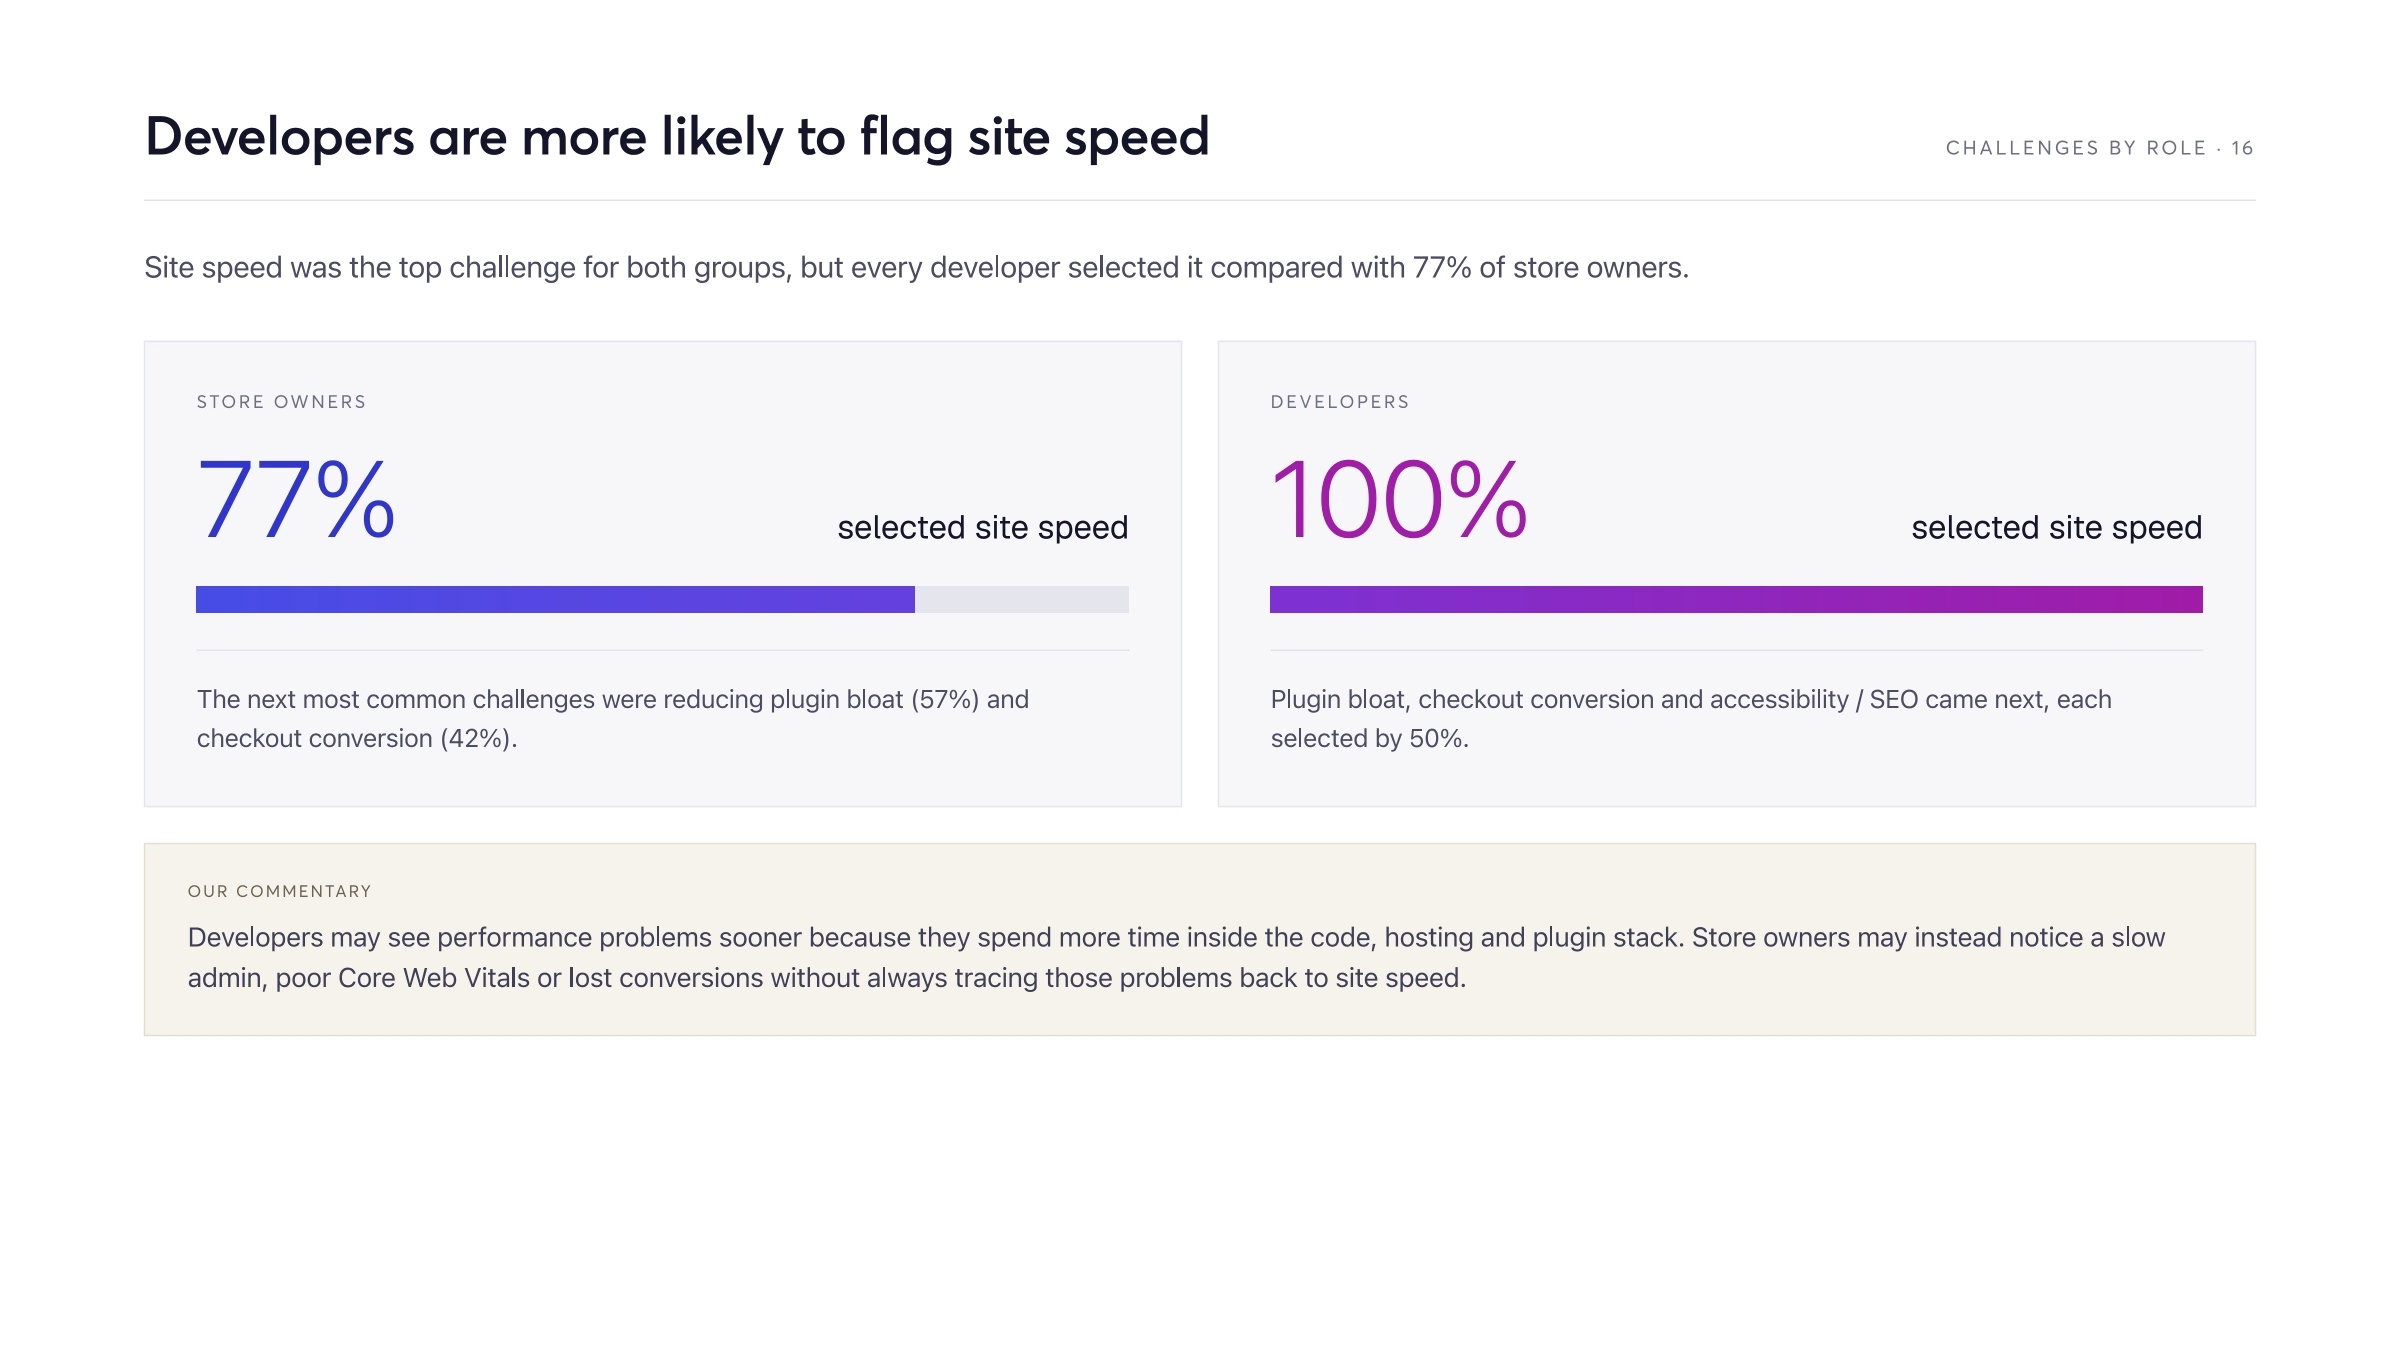
Among solo store owners, 77% selected site speed, 57% plugin bloat, and 42% checkout conversion.
Among developers, 100% selected site speed, while 50% selected plugin bloat and 50% accessibility or SEO.
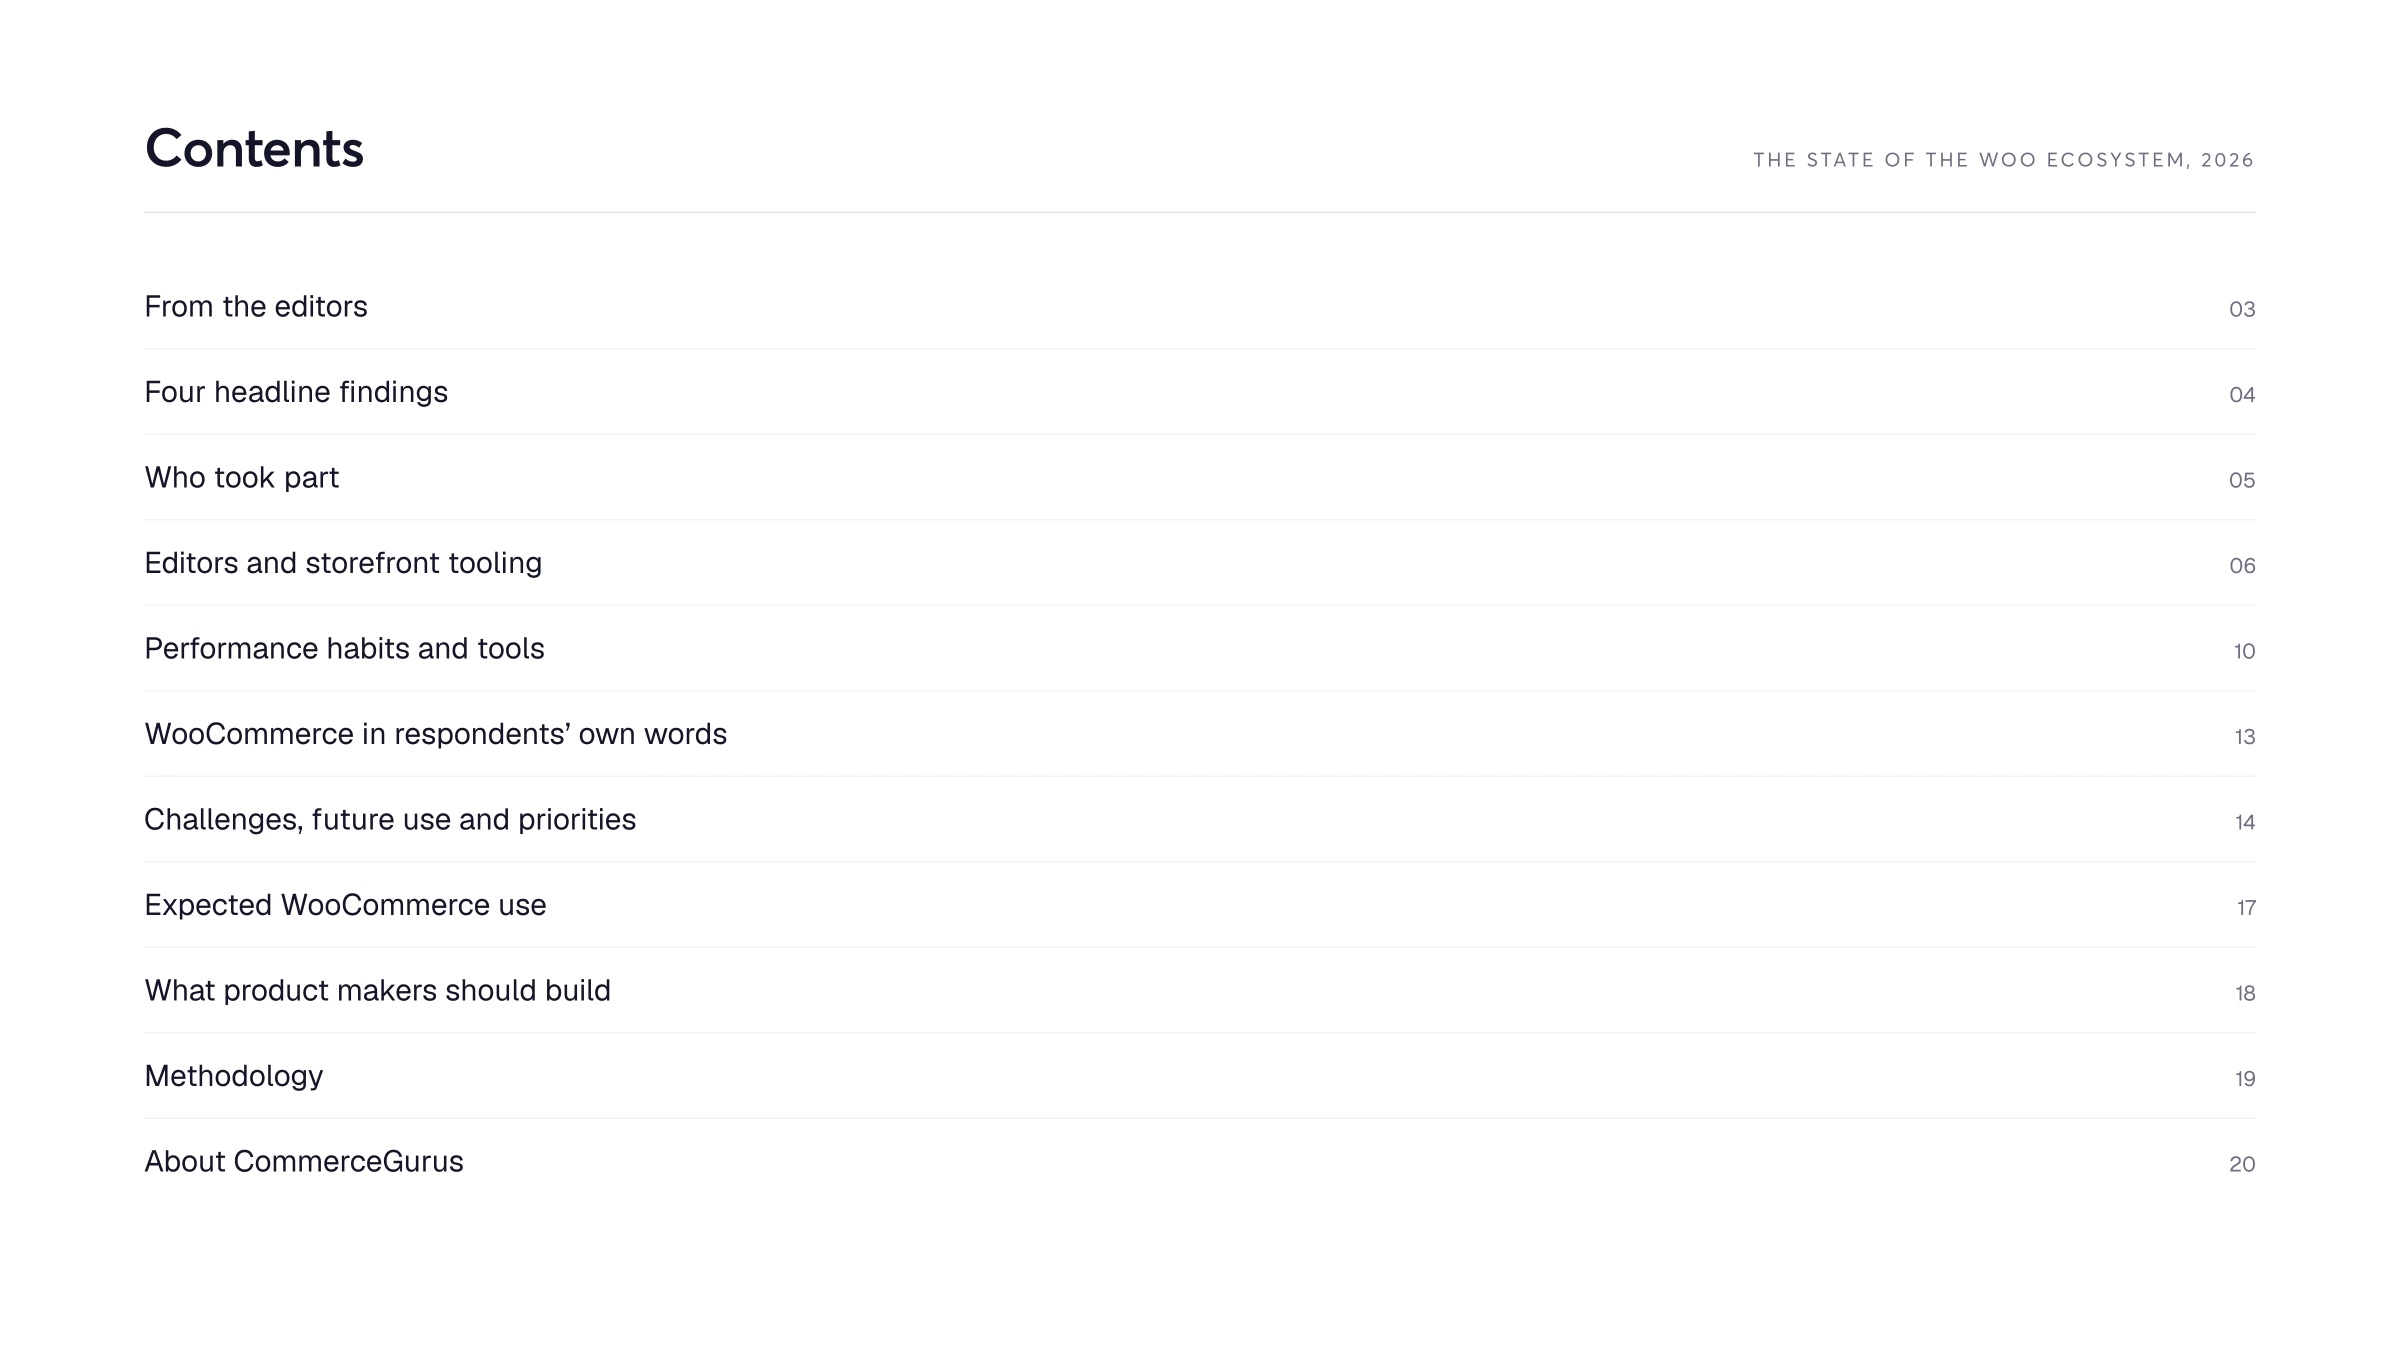
Expected WooCommerce use
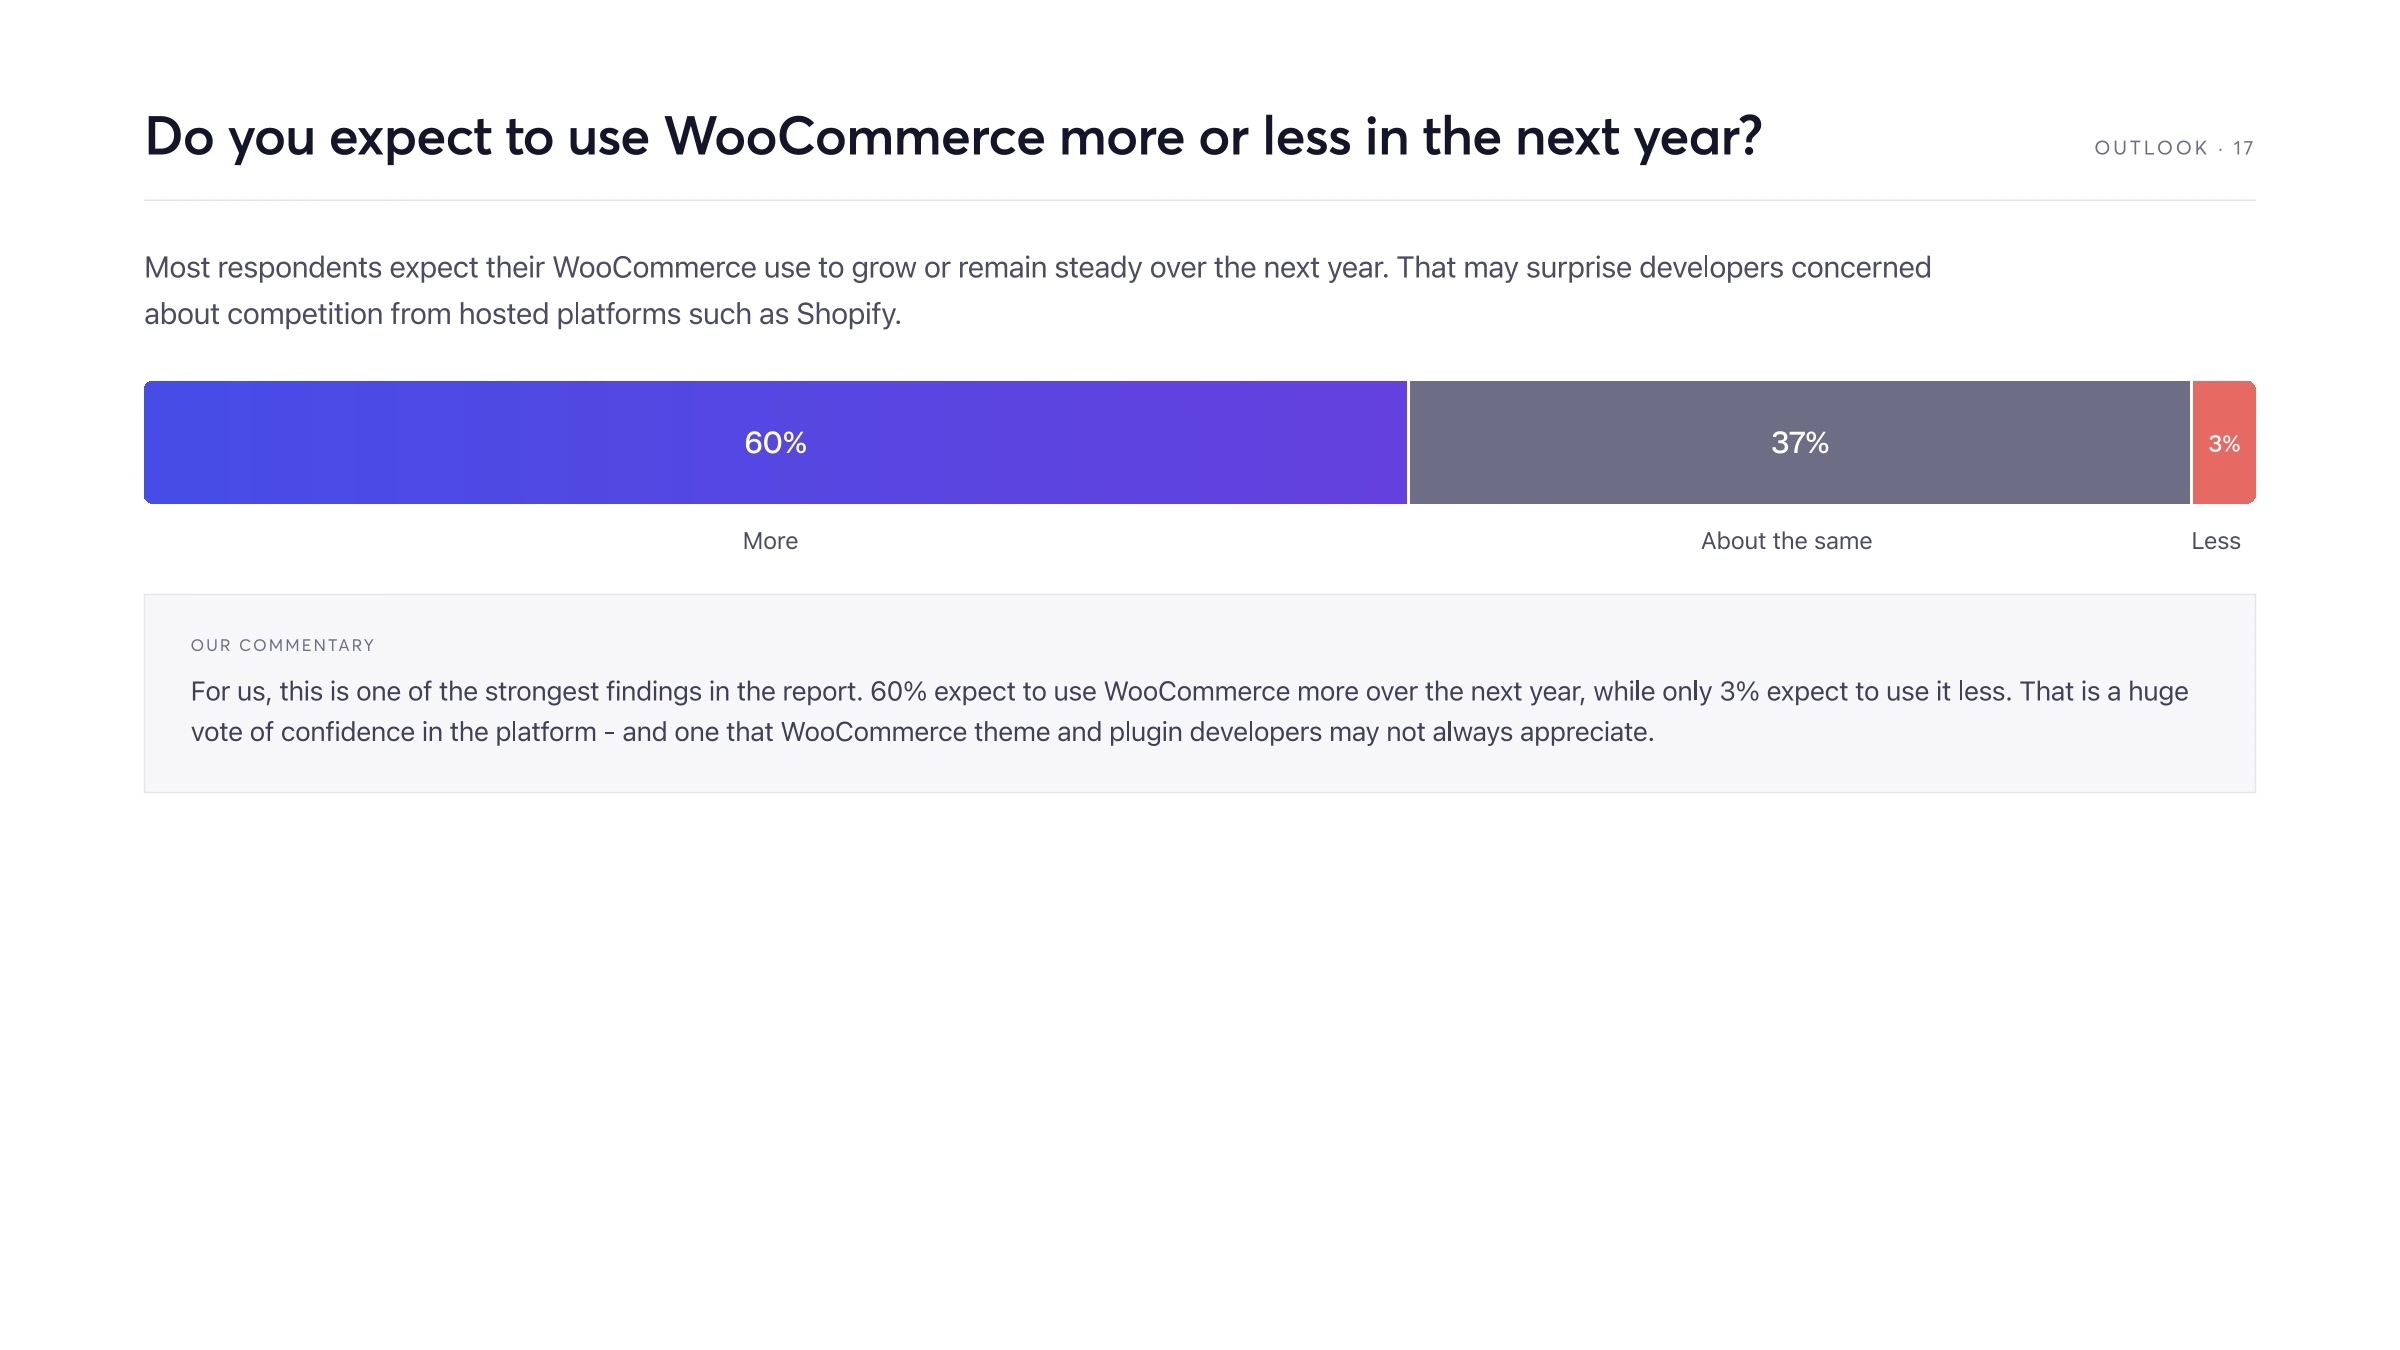
60% expect to use WooCommerce more in the next year, 37% expect about the same use, and 3% expect less.
97% expect their WooCommerce use to grow or remain steady.
What product makers should build
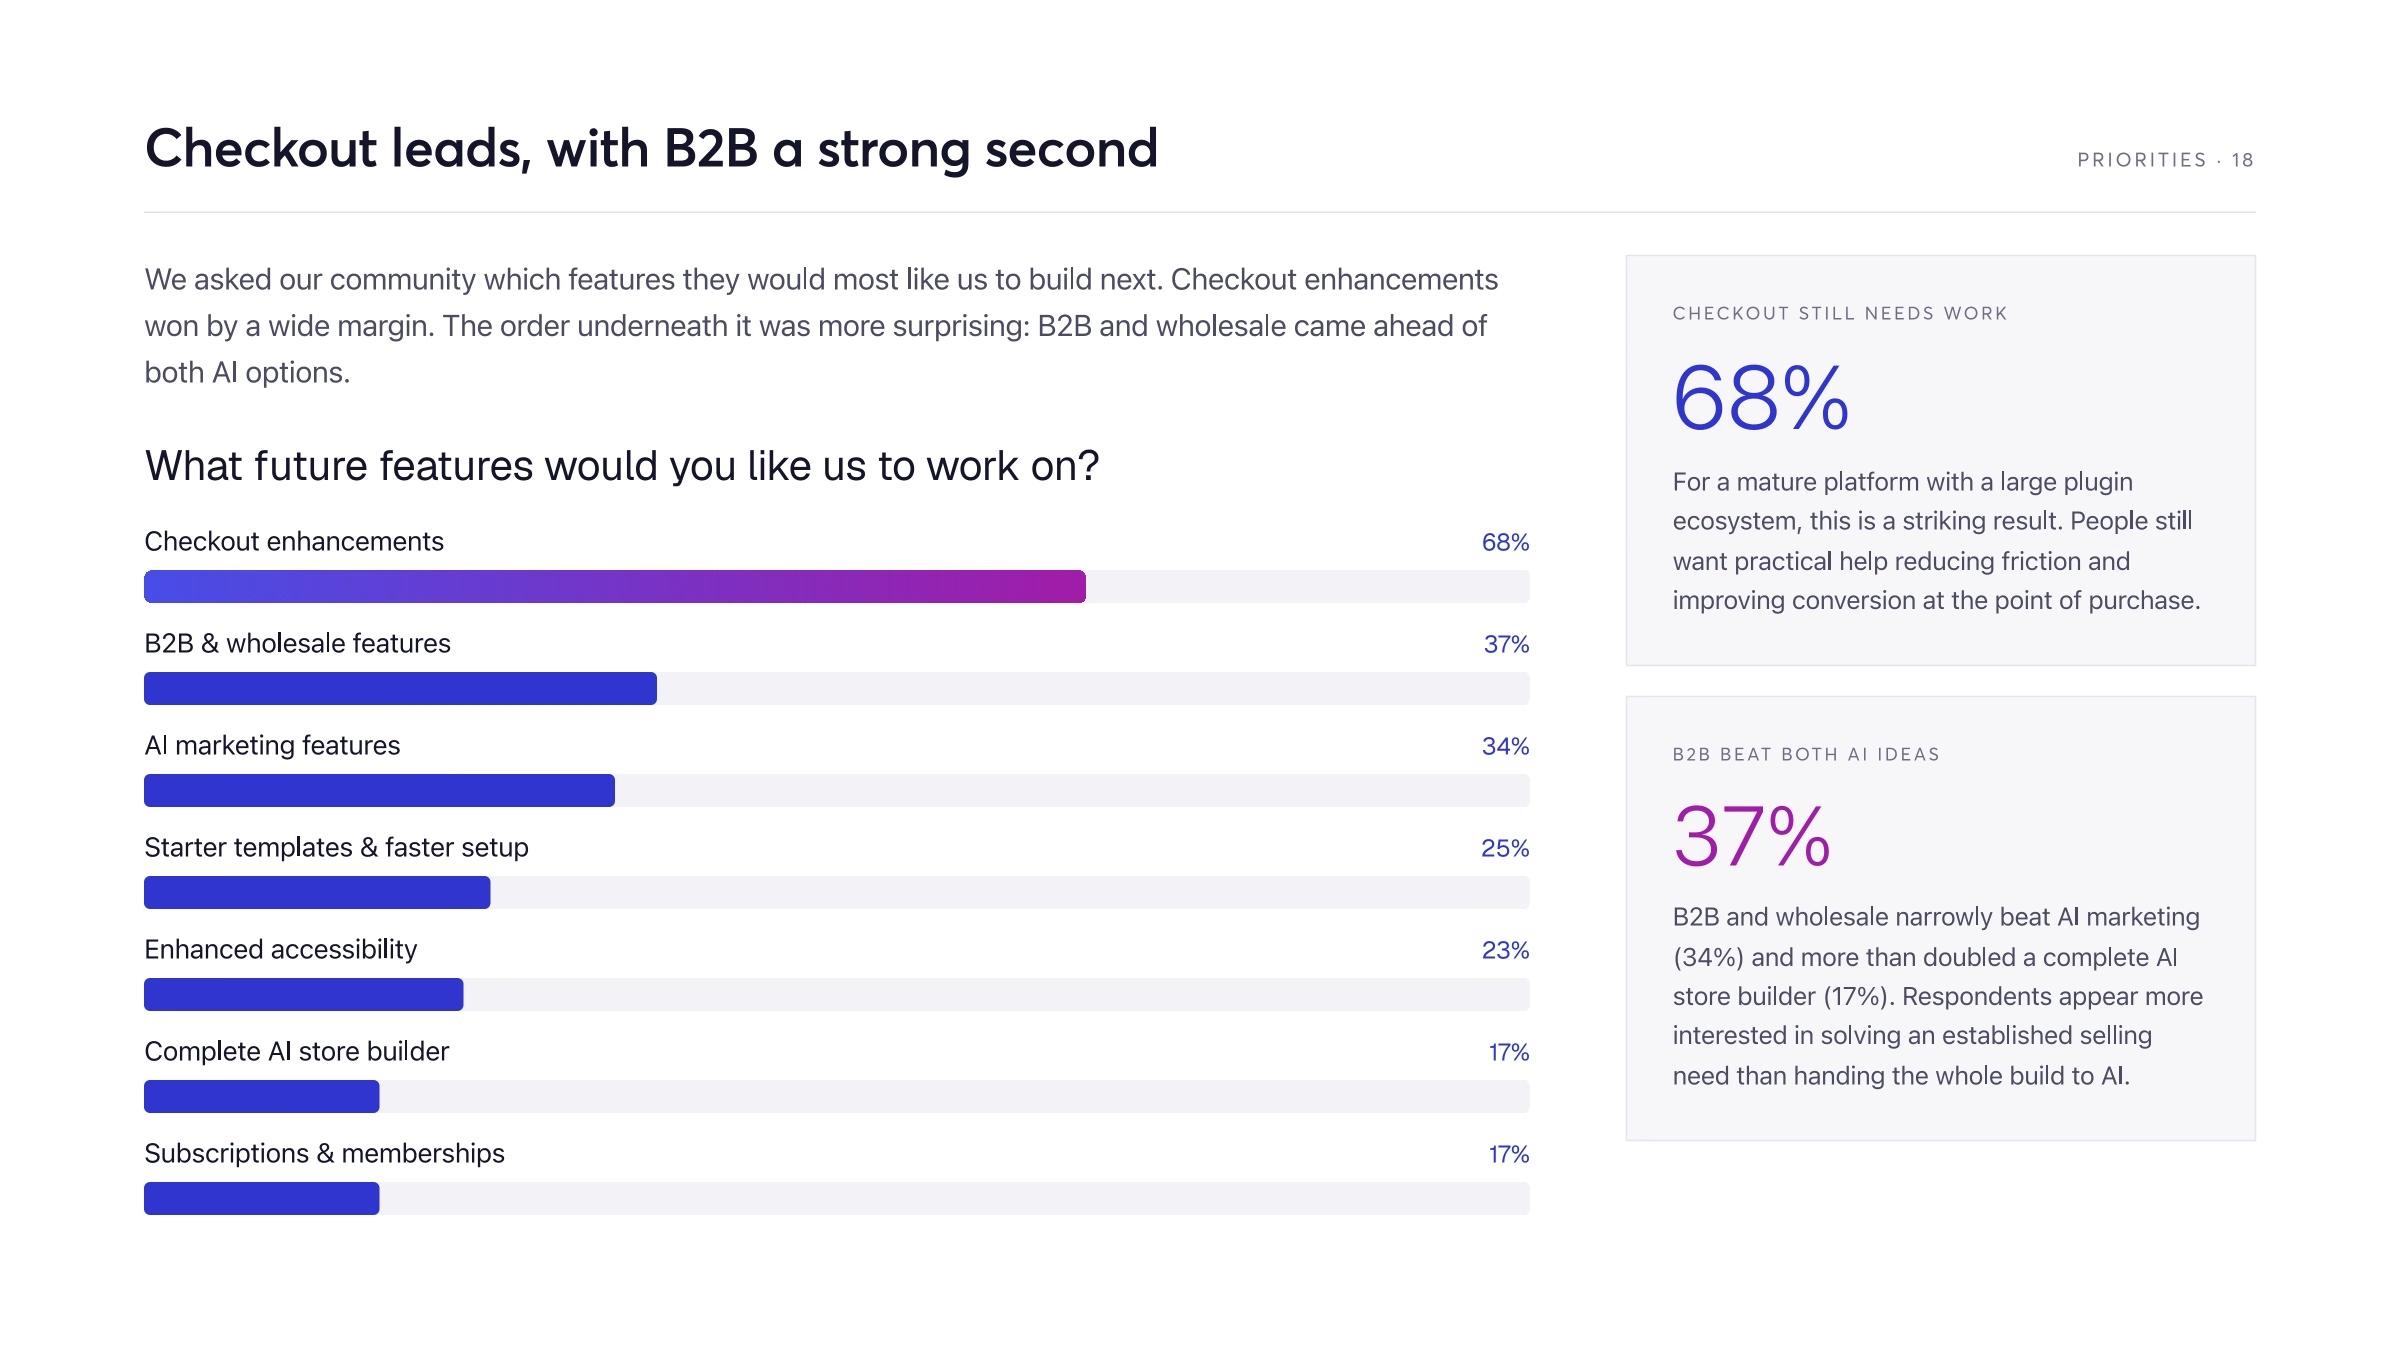
68% selected checkout enhancements, leading every other future product category.
37% selected B2B and wholesale features, 31 percentage points behind checkout and three points ahead of AI marketing features.
AI marketing features were selected by 34%, starter templates and faster setup by 25%, and accessibility by 23%.
Complete AI store-building and subscriptions or memberships were each selected by 17%.